Statistical inference
Overview
These visualizations help identify which parts of the coefficient surfaces are statistically significant. For each functional predictor, we show two types of plots:
- p-value plots: Showing the pointwise p-values with with darker colors indicating smaller p-values (more significant effects) and contour lines at common significance levels (0.01, 0.05, 0.1)
- t-value plots: Showing the pointwise t-statistics across the coefficient surface
Price lag coefficients
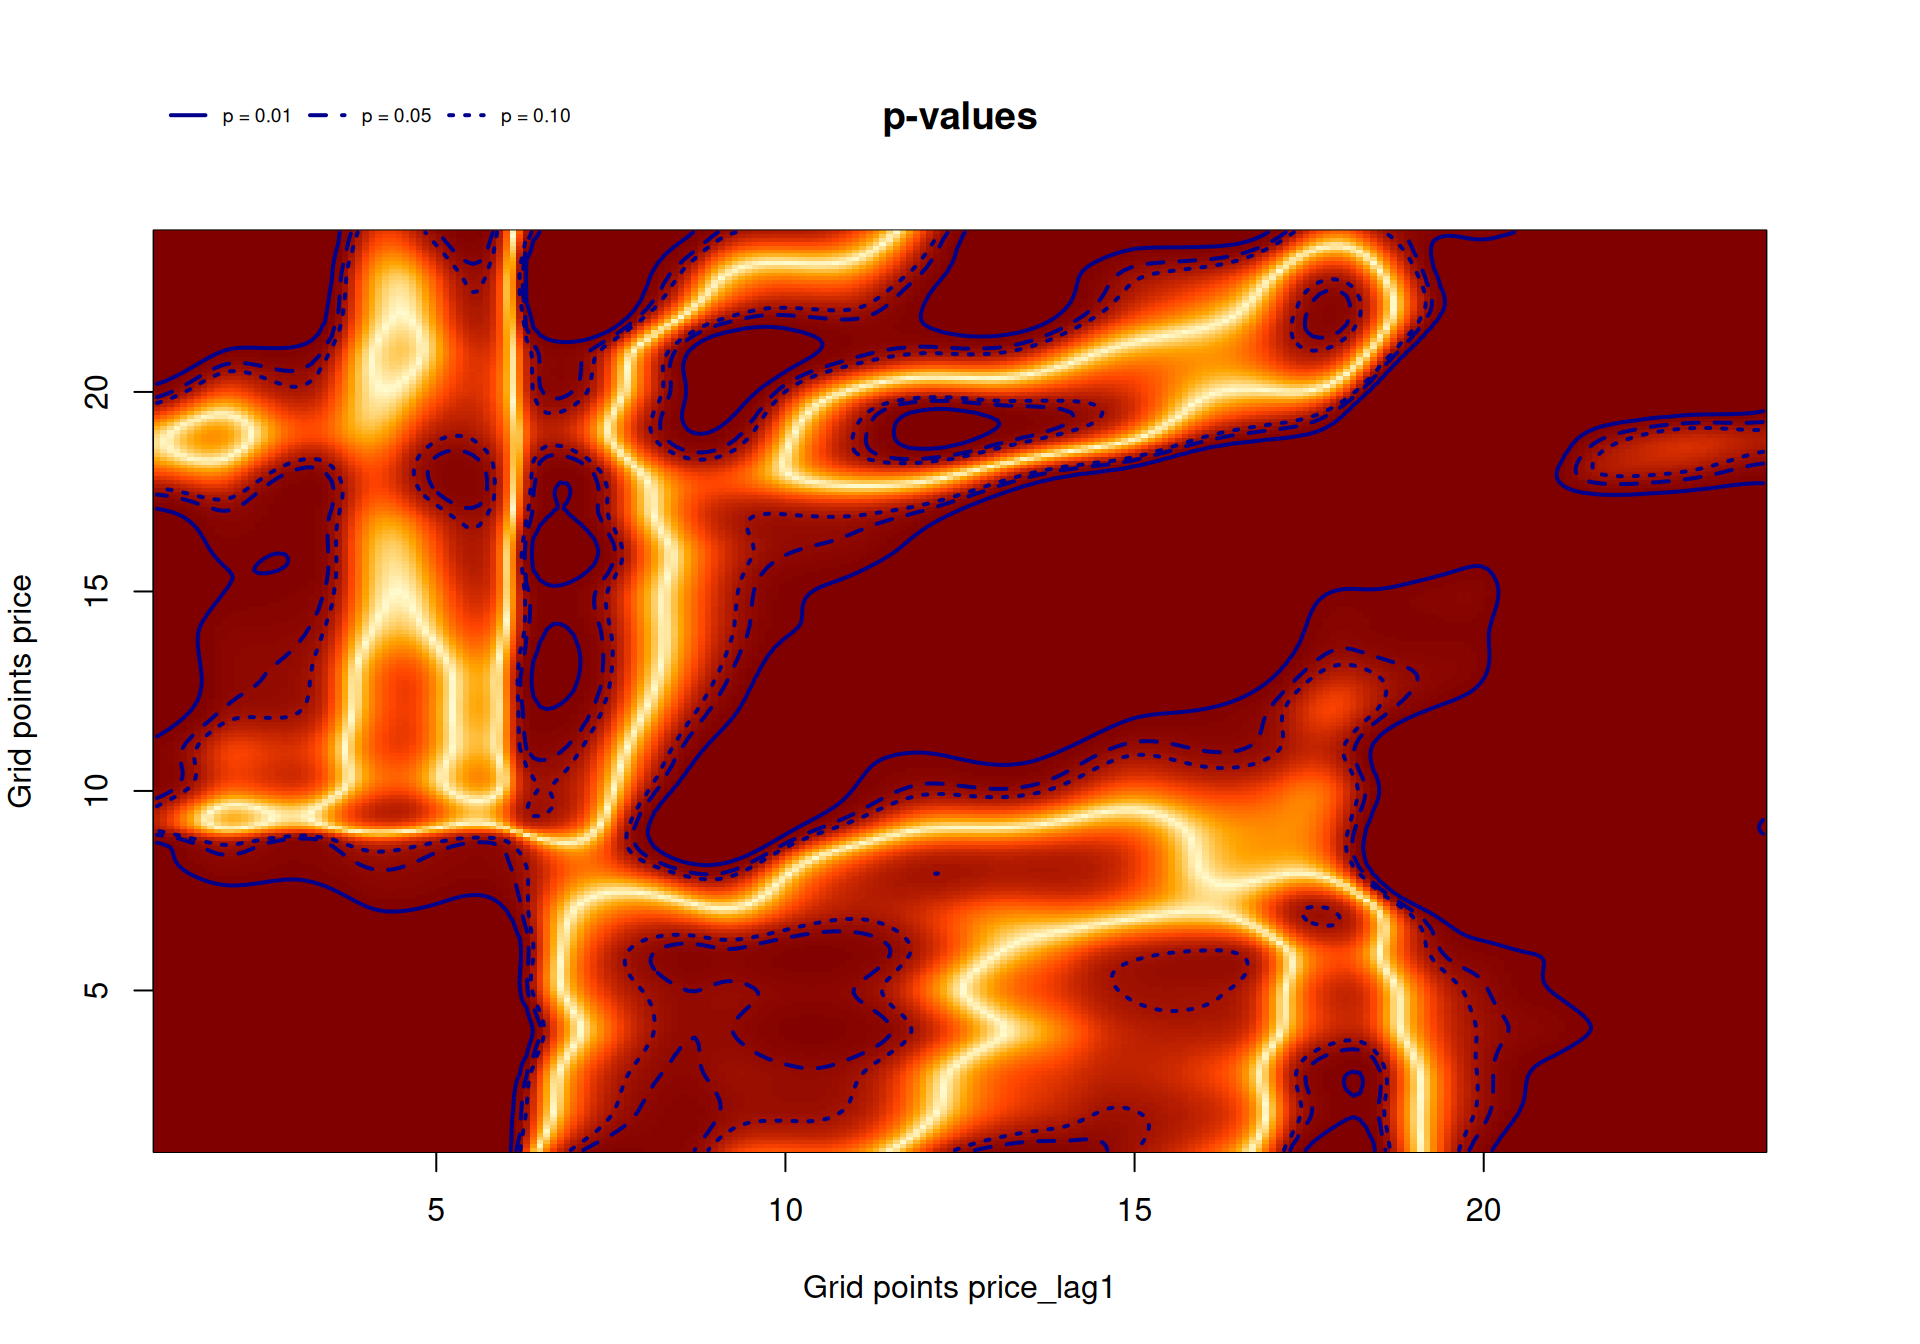
Figure 1: p-values for the one day lagged price coefficient.
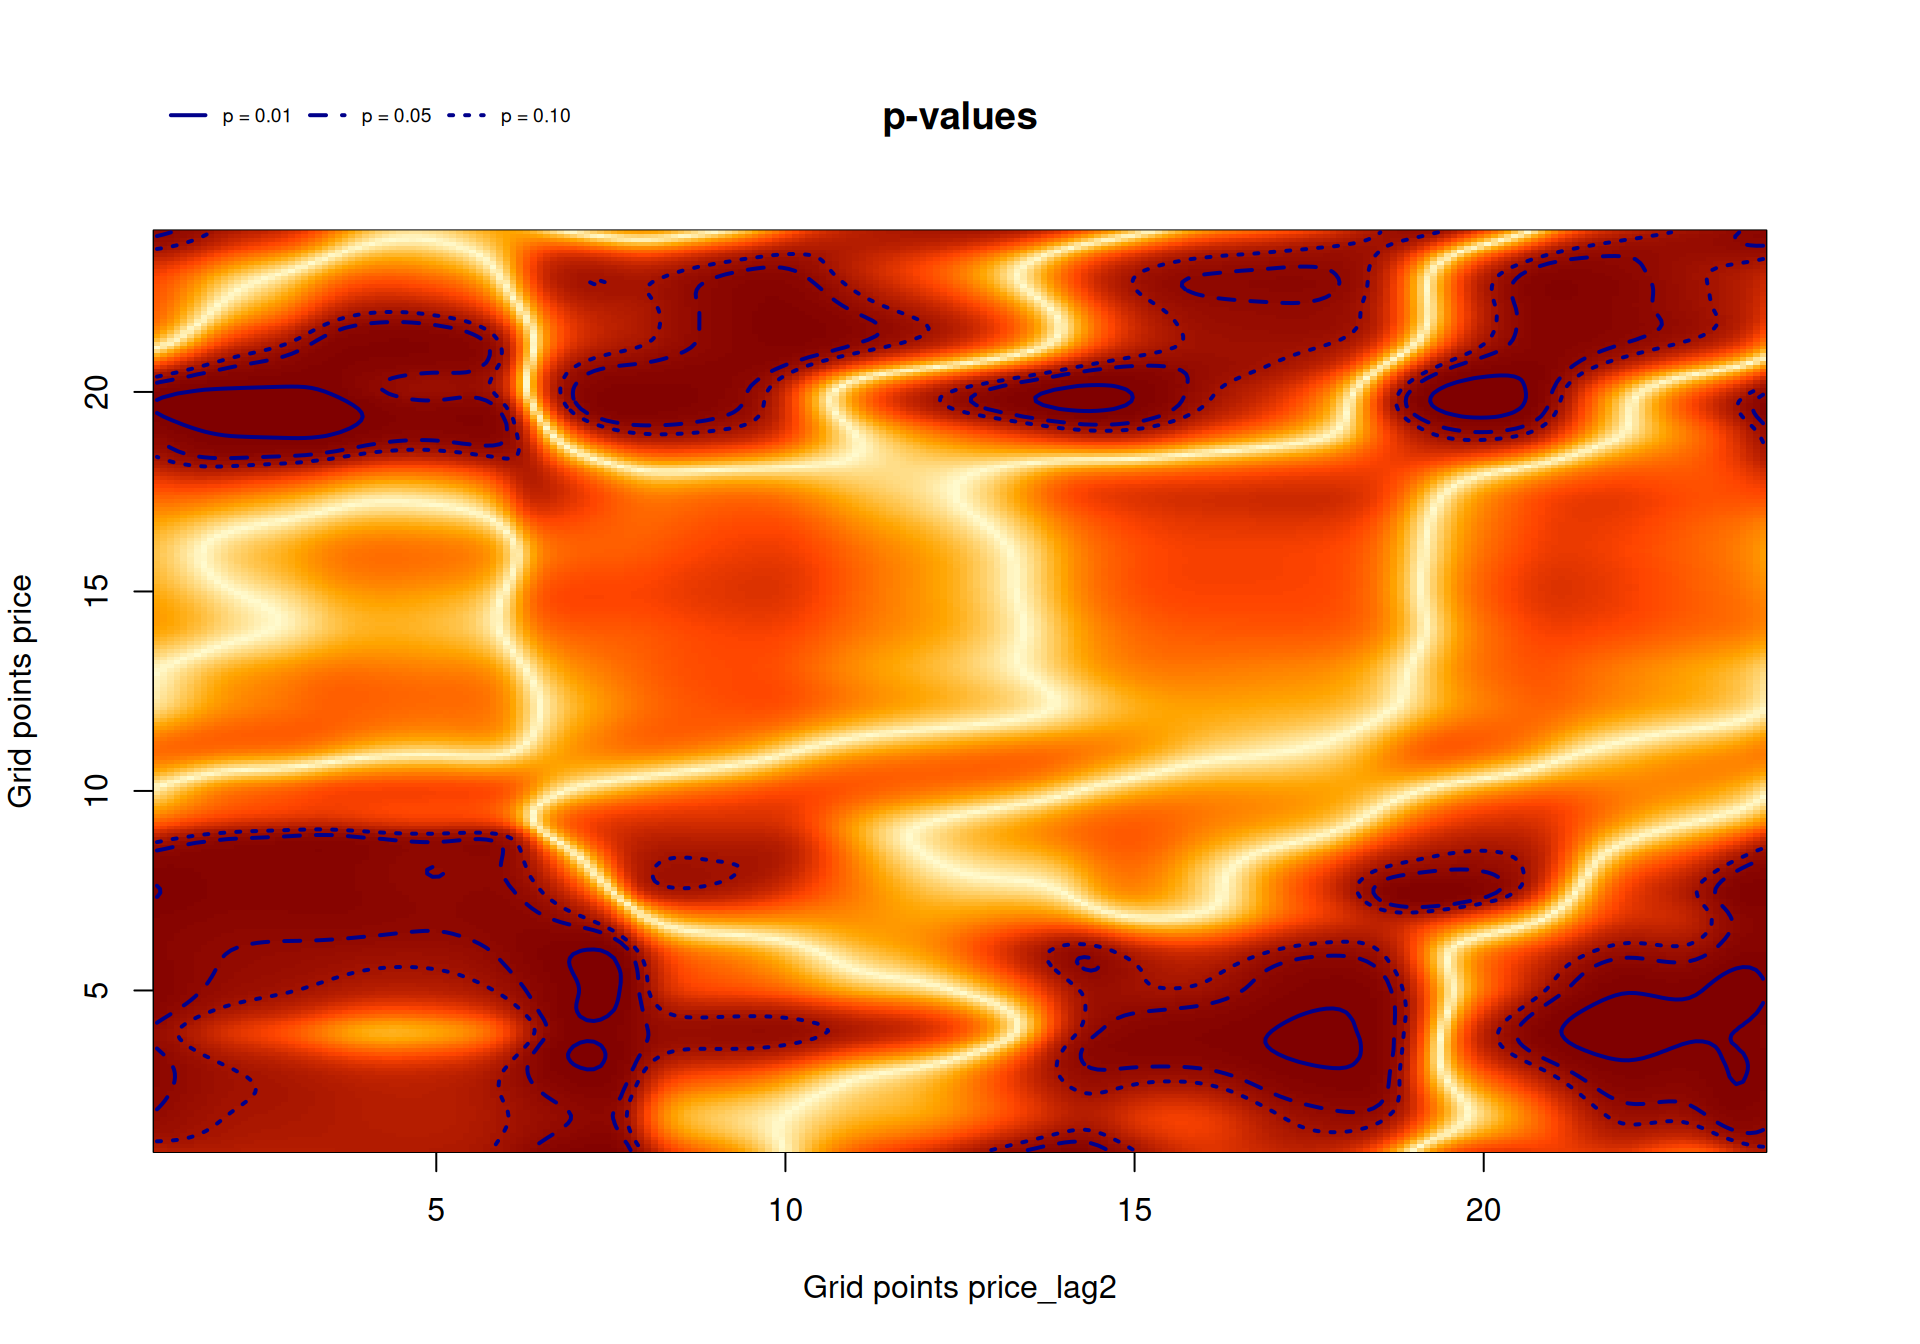
Figure 2: p-values for the two days lagged price coefficient.
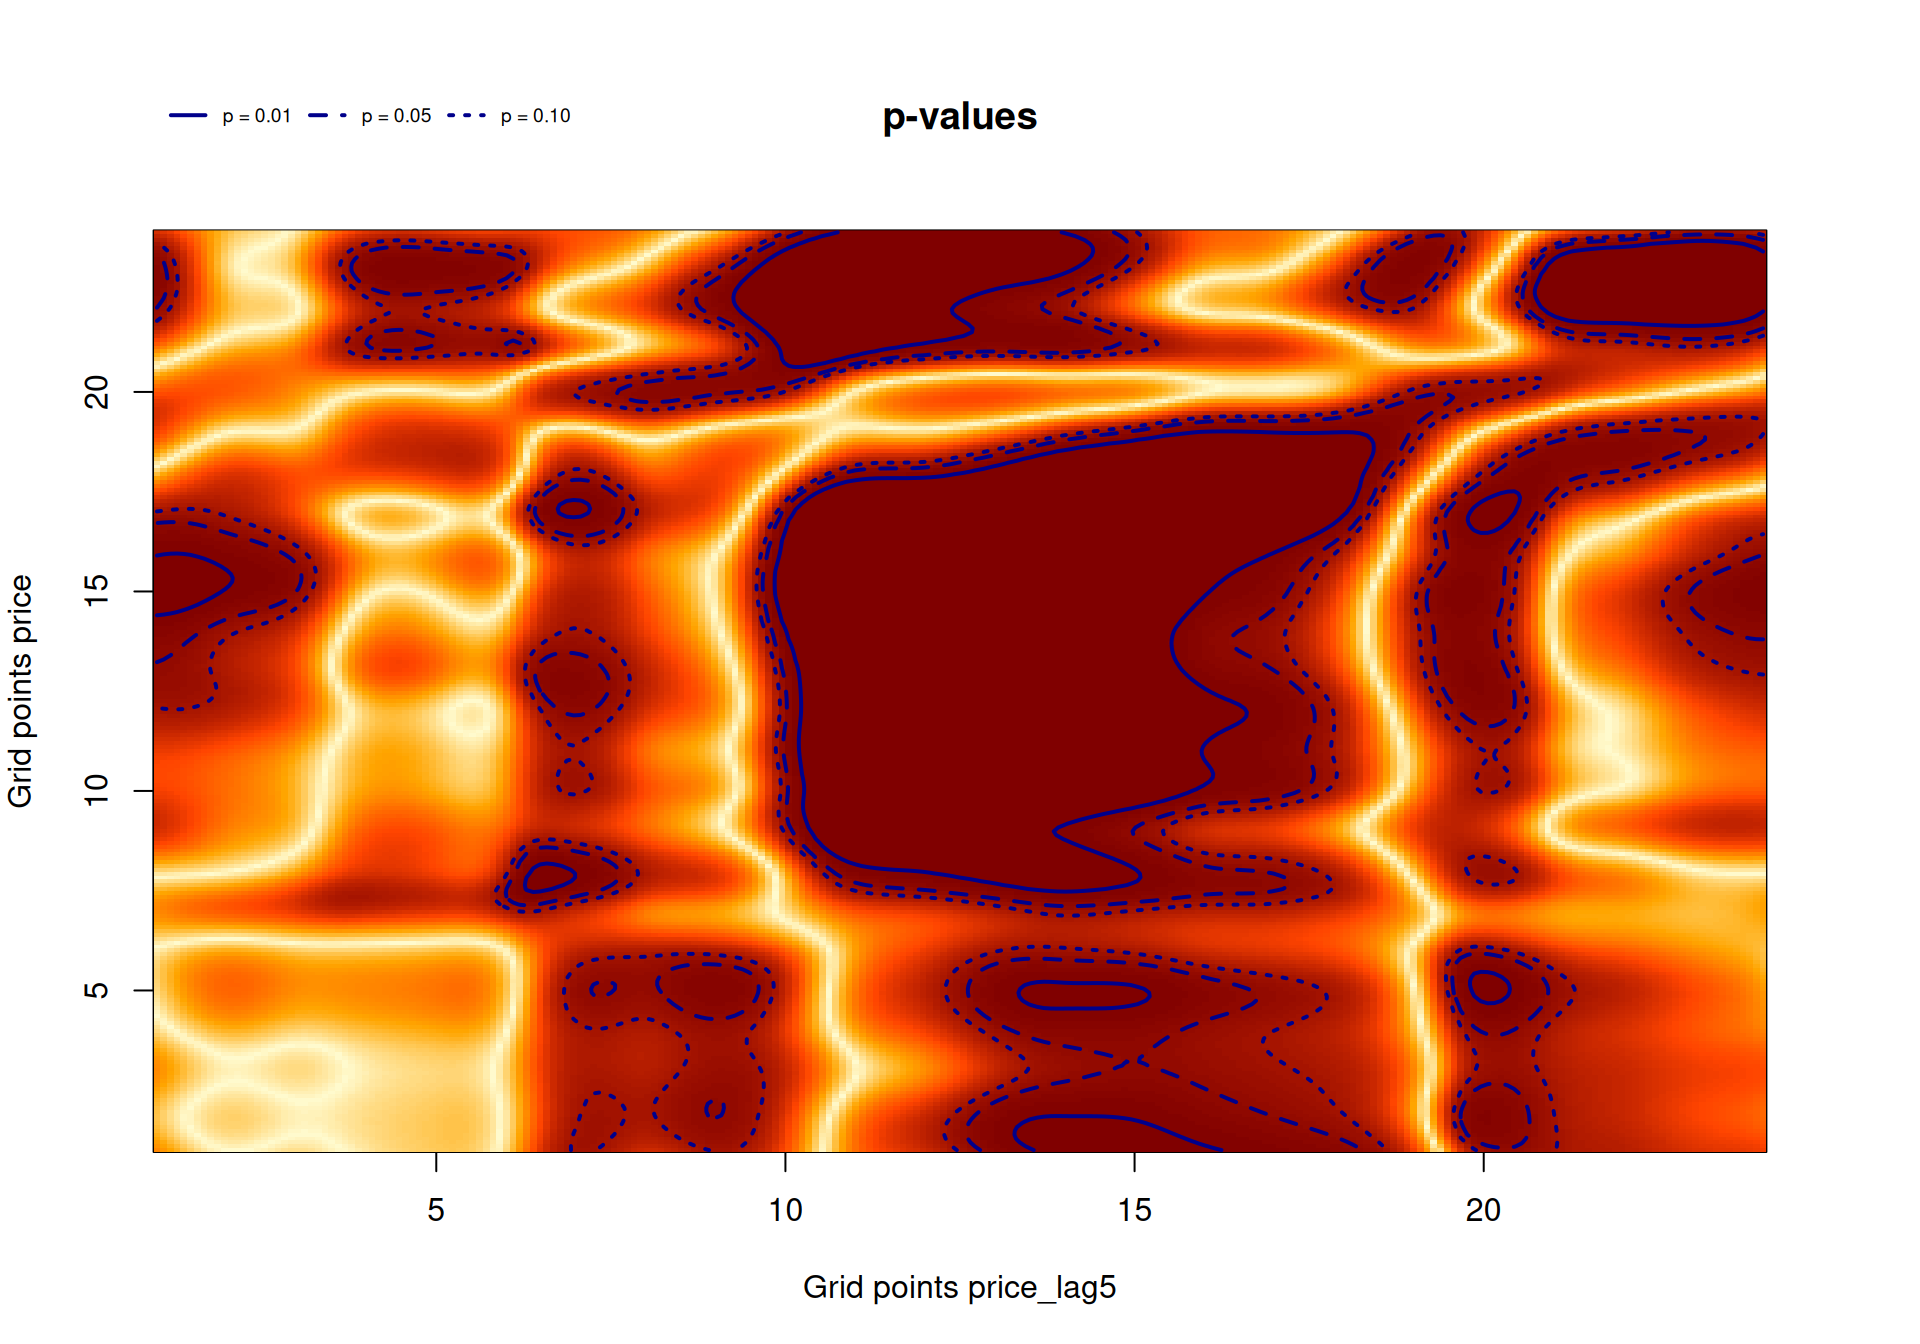
Figure 3: p-values for the one week lagged price coefficient.
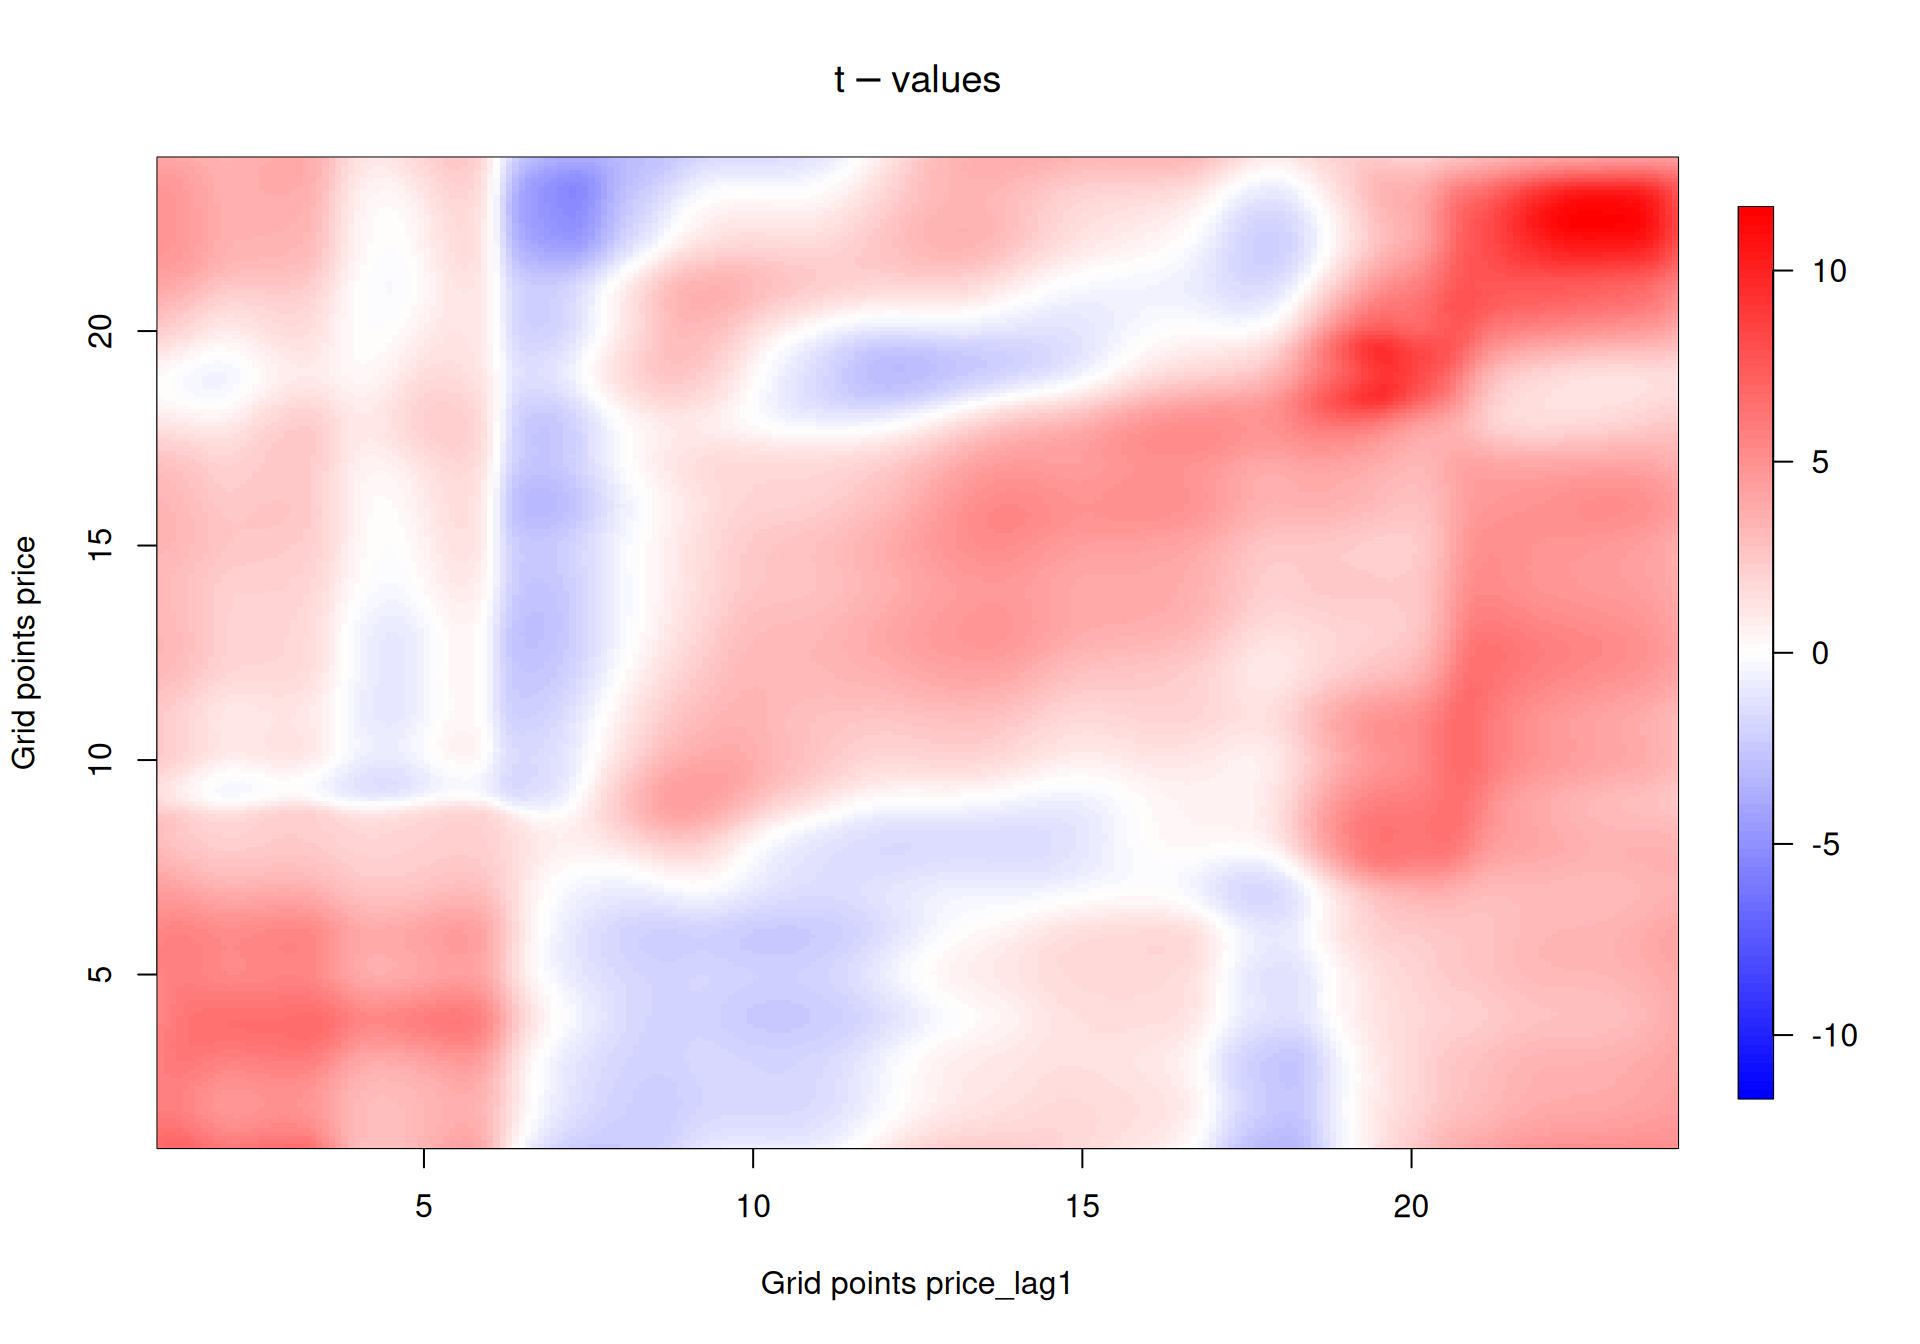
Figure 4: t-values for the one day lagged price coefficient.
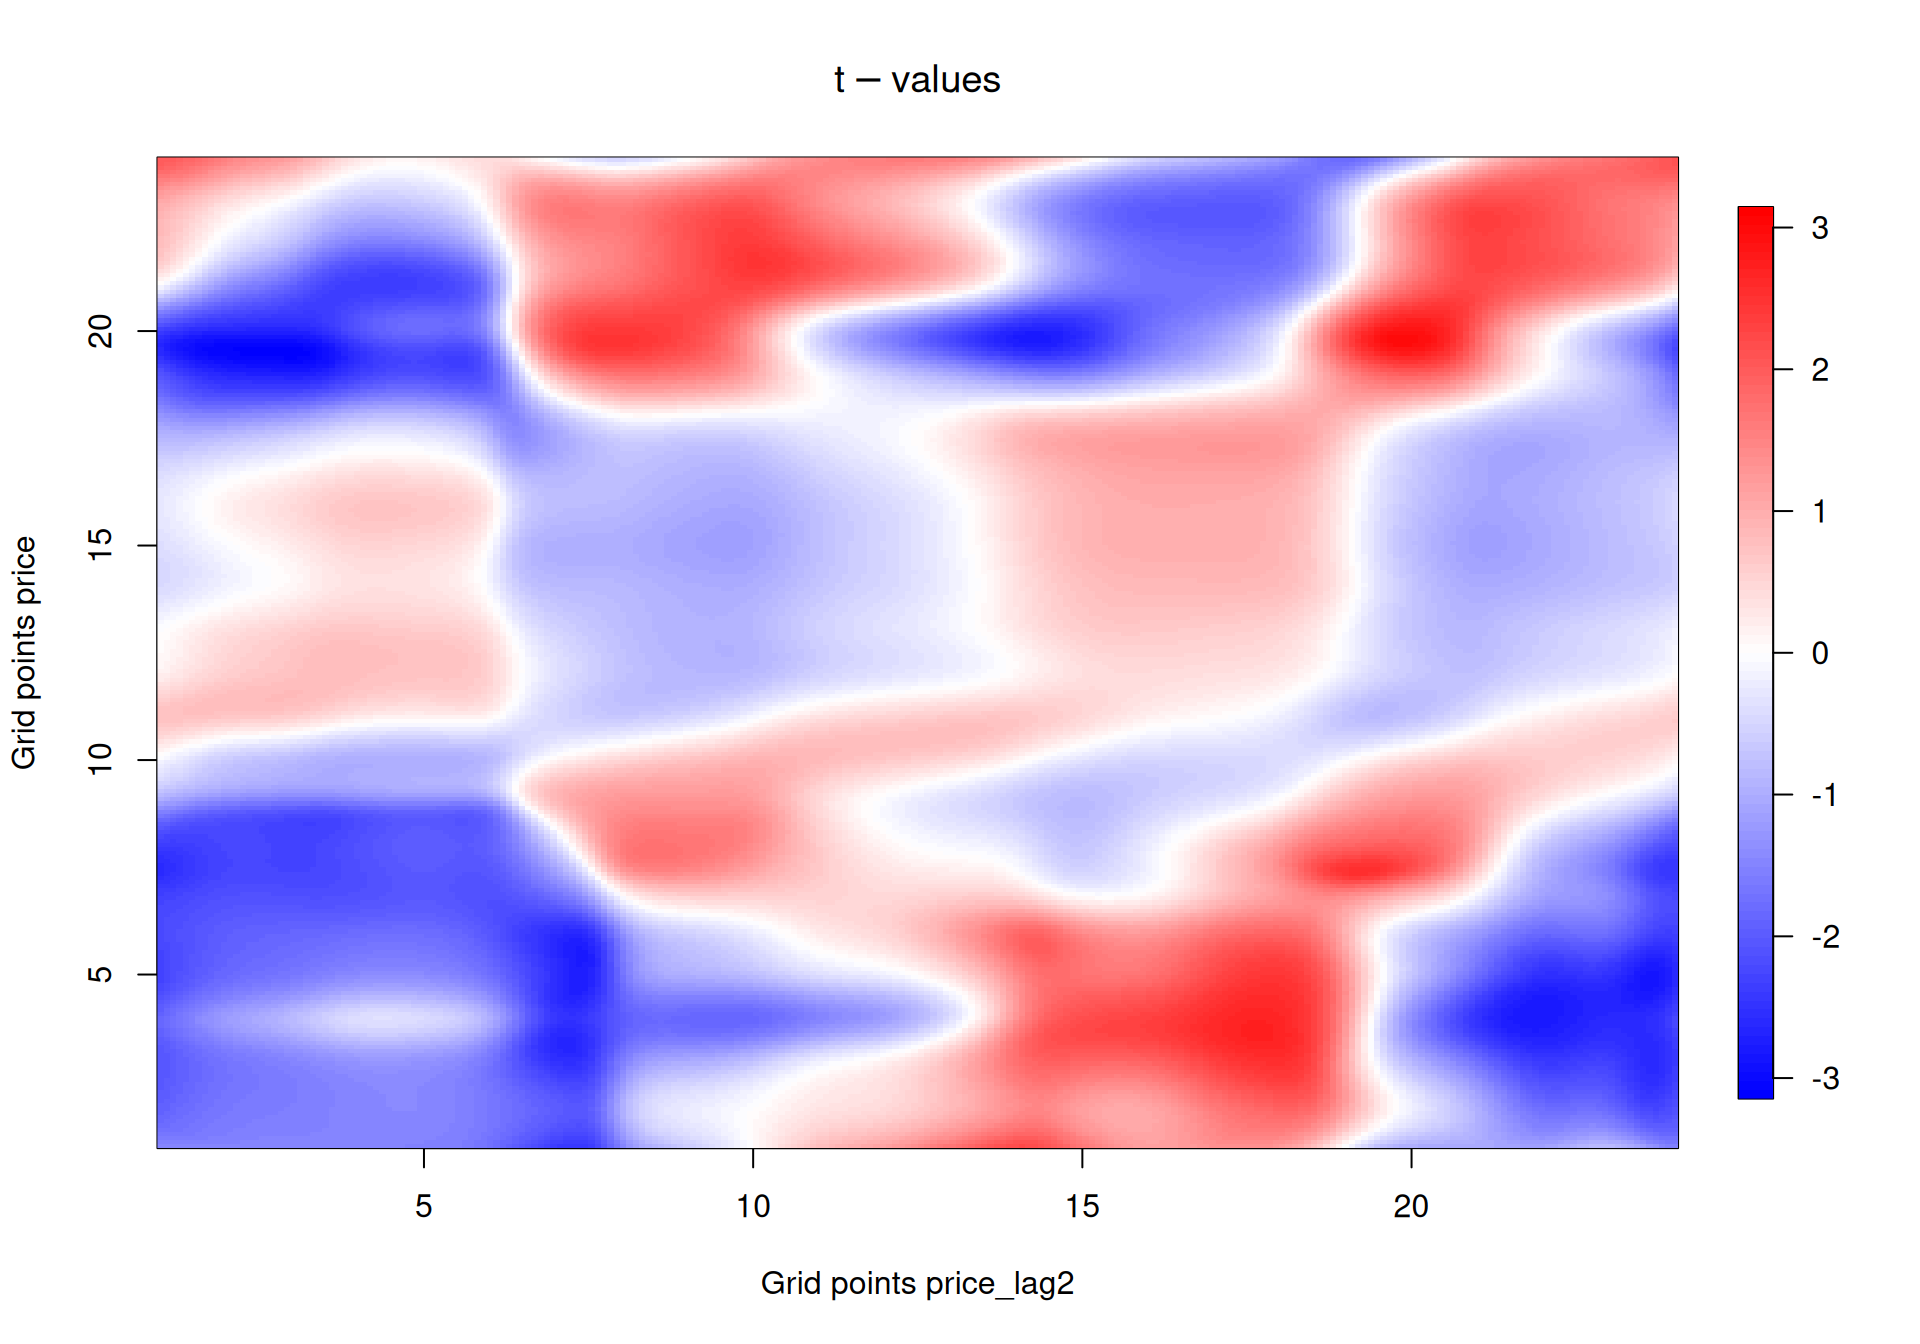
Figure 5: t-values for the two days lagged price coefficient.
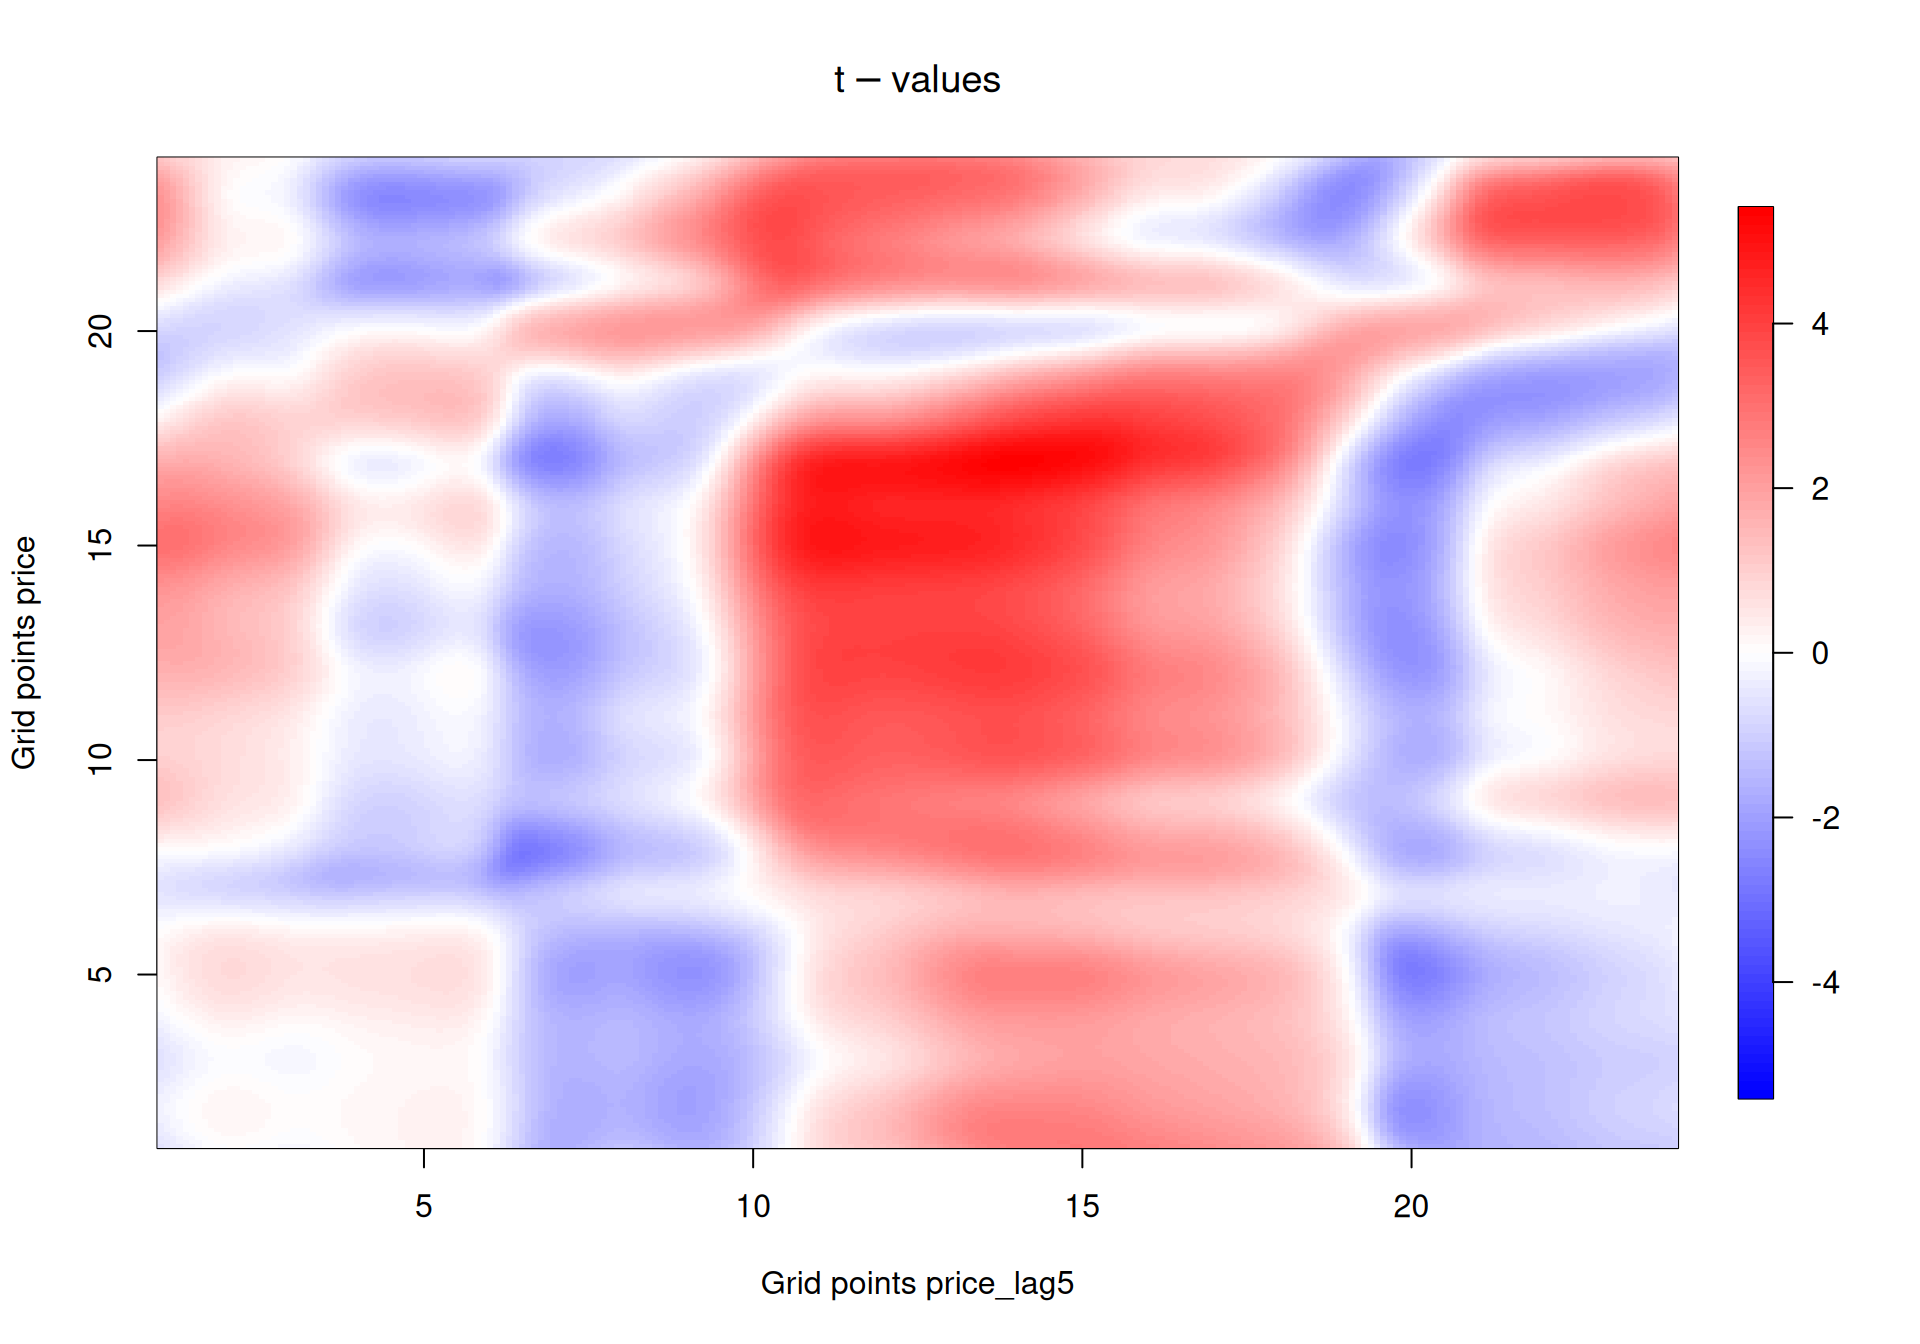
Figure 6: t-values for the one week lagged price coefficient.
Load forecast coefficients
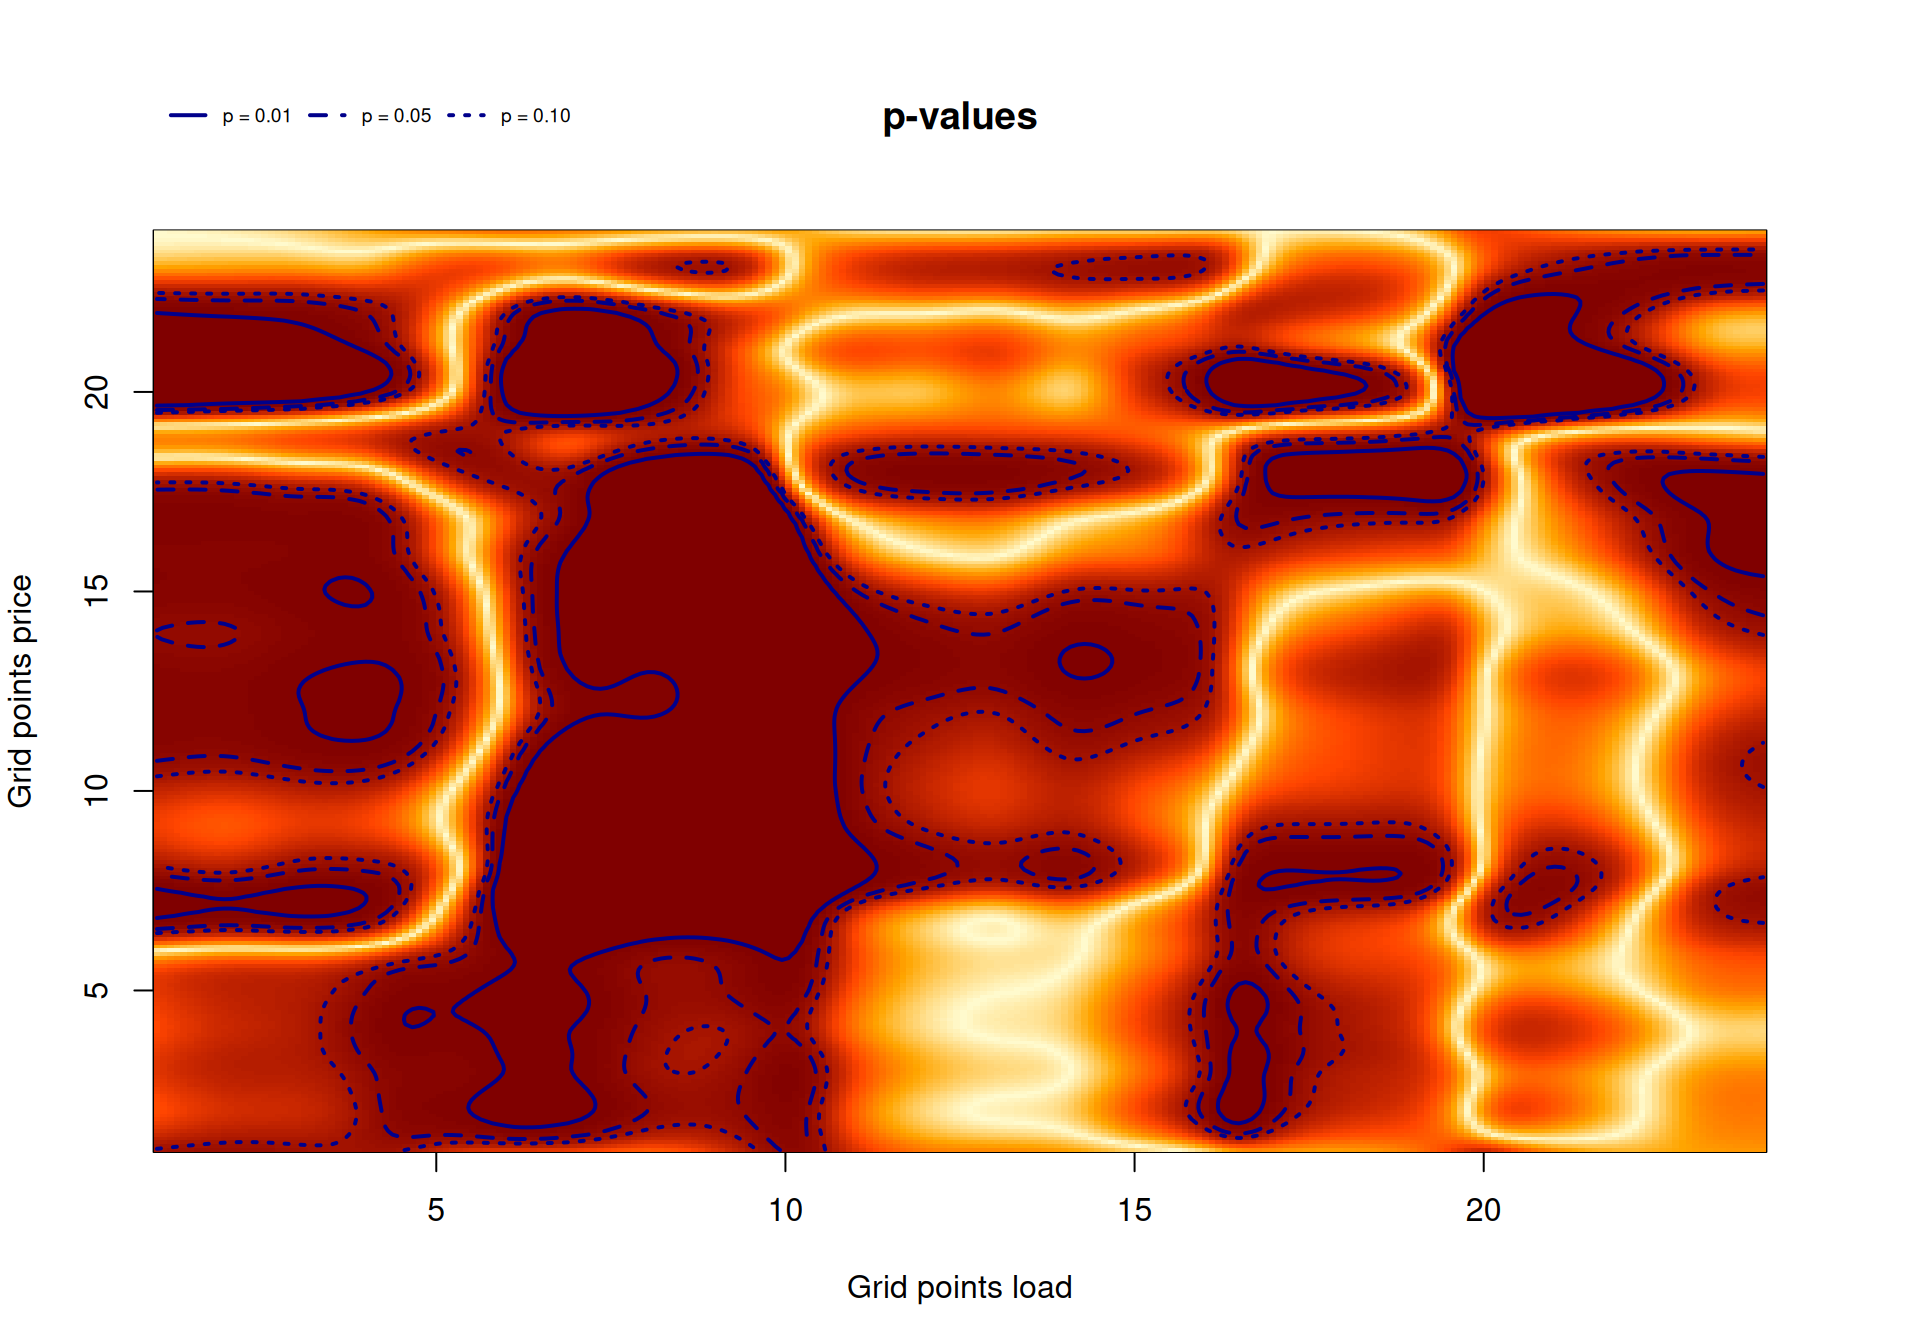
Figure 7: p-values for the forecasted electricity load coefficient.
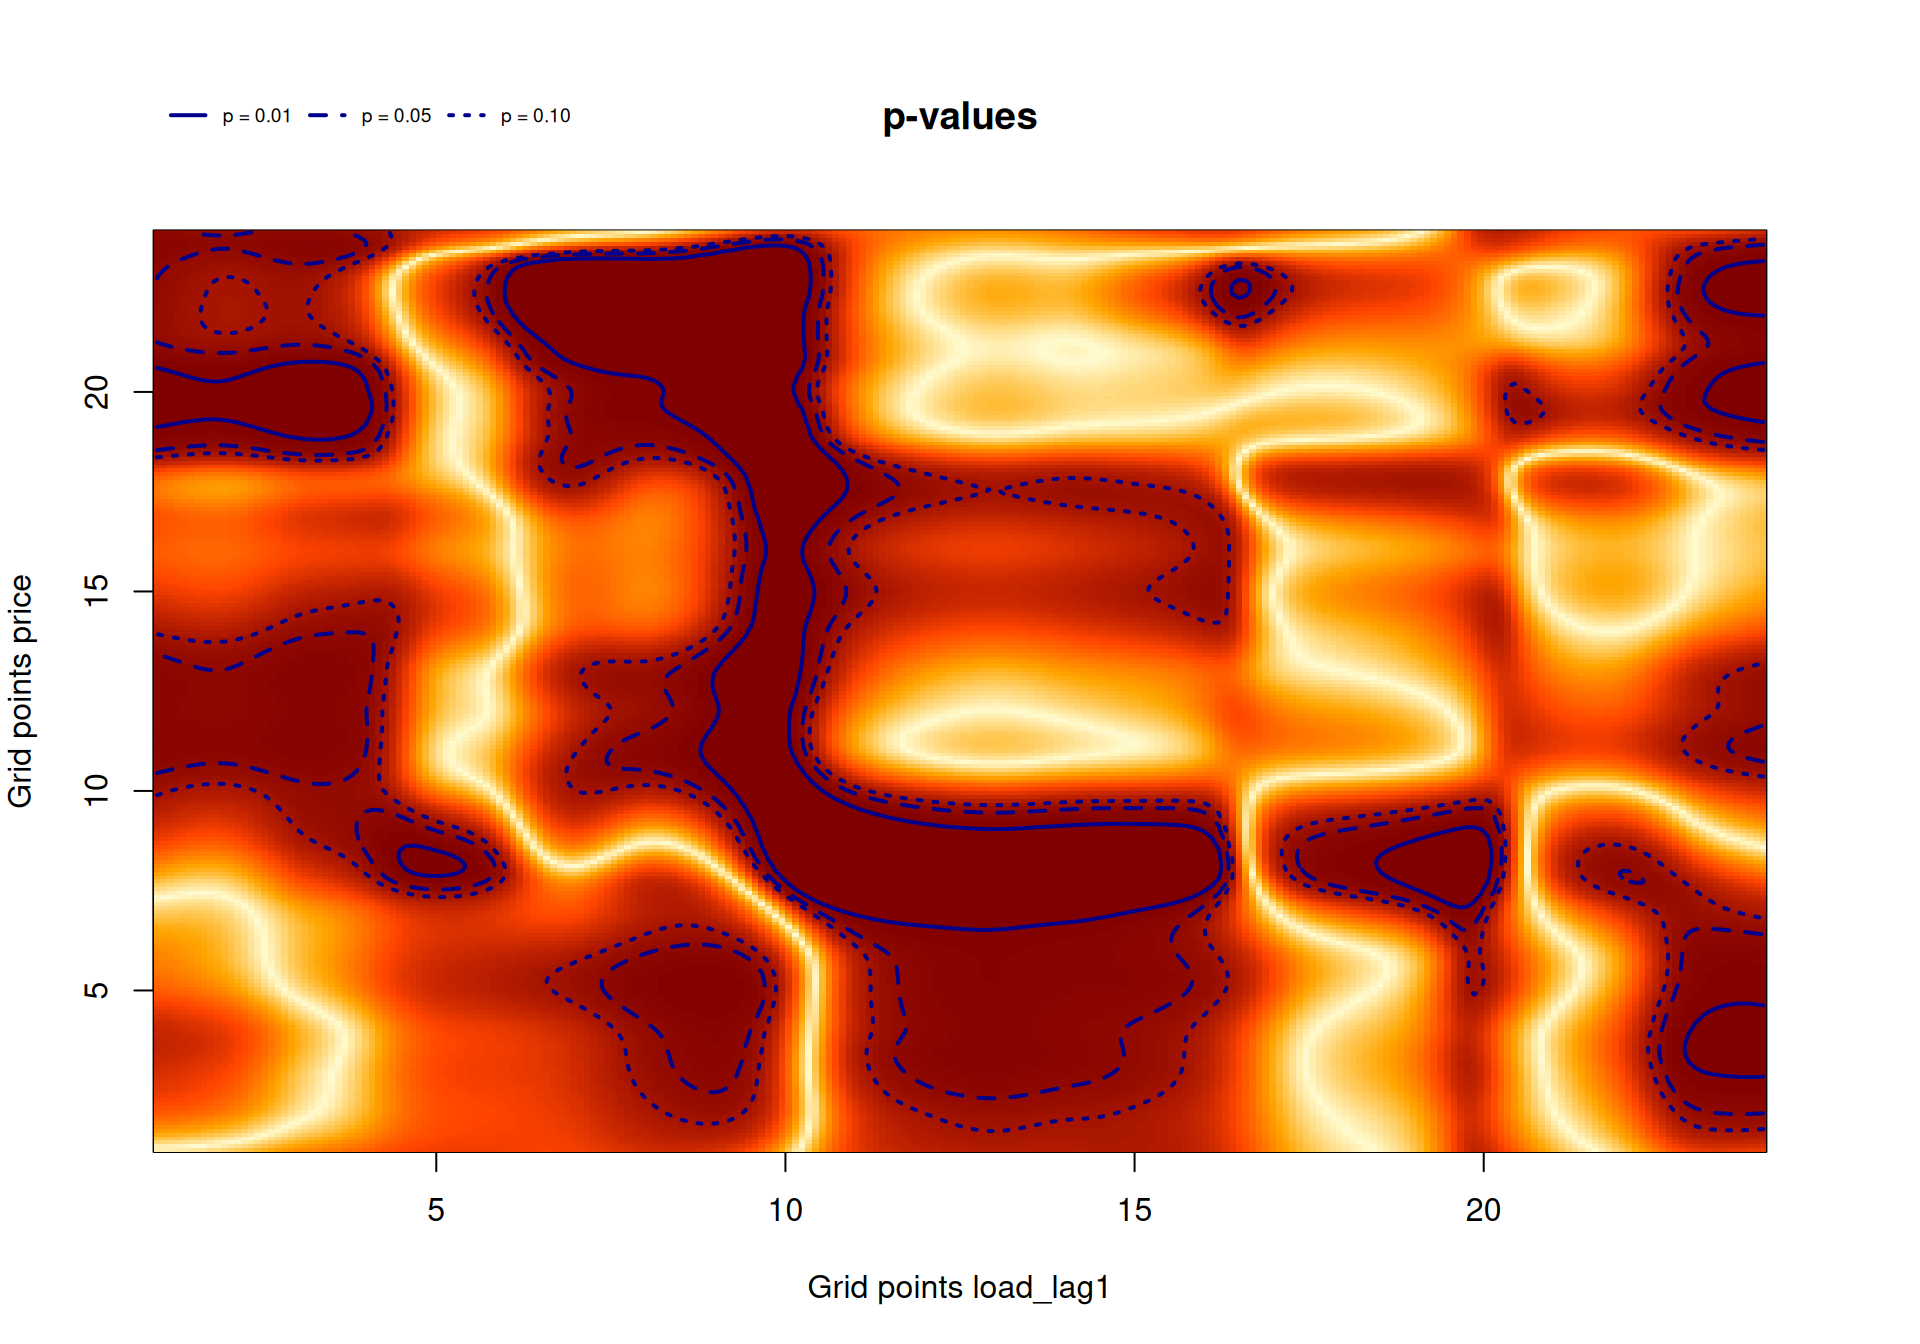
Figure 8: p-values for the one day lagged forecasted electricity load coefficient.
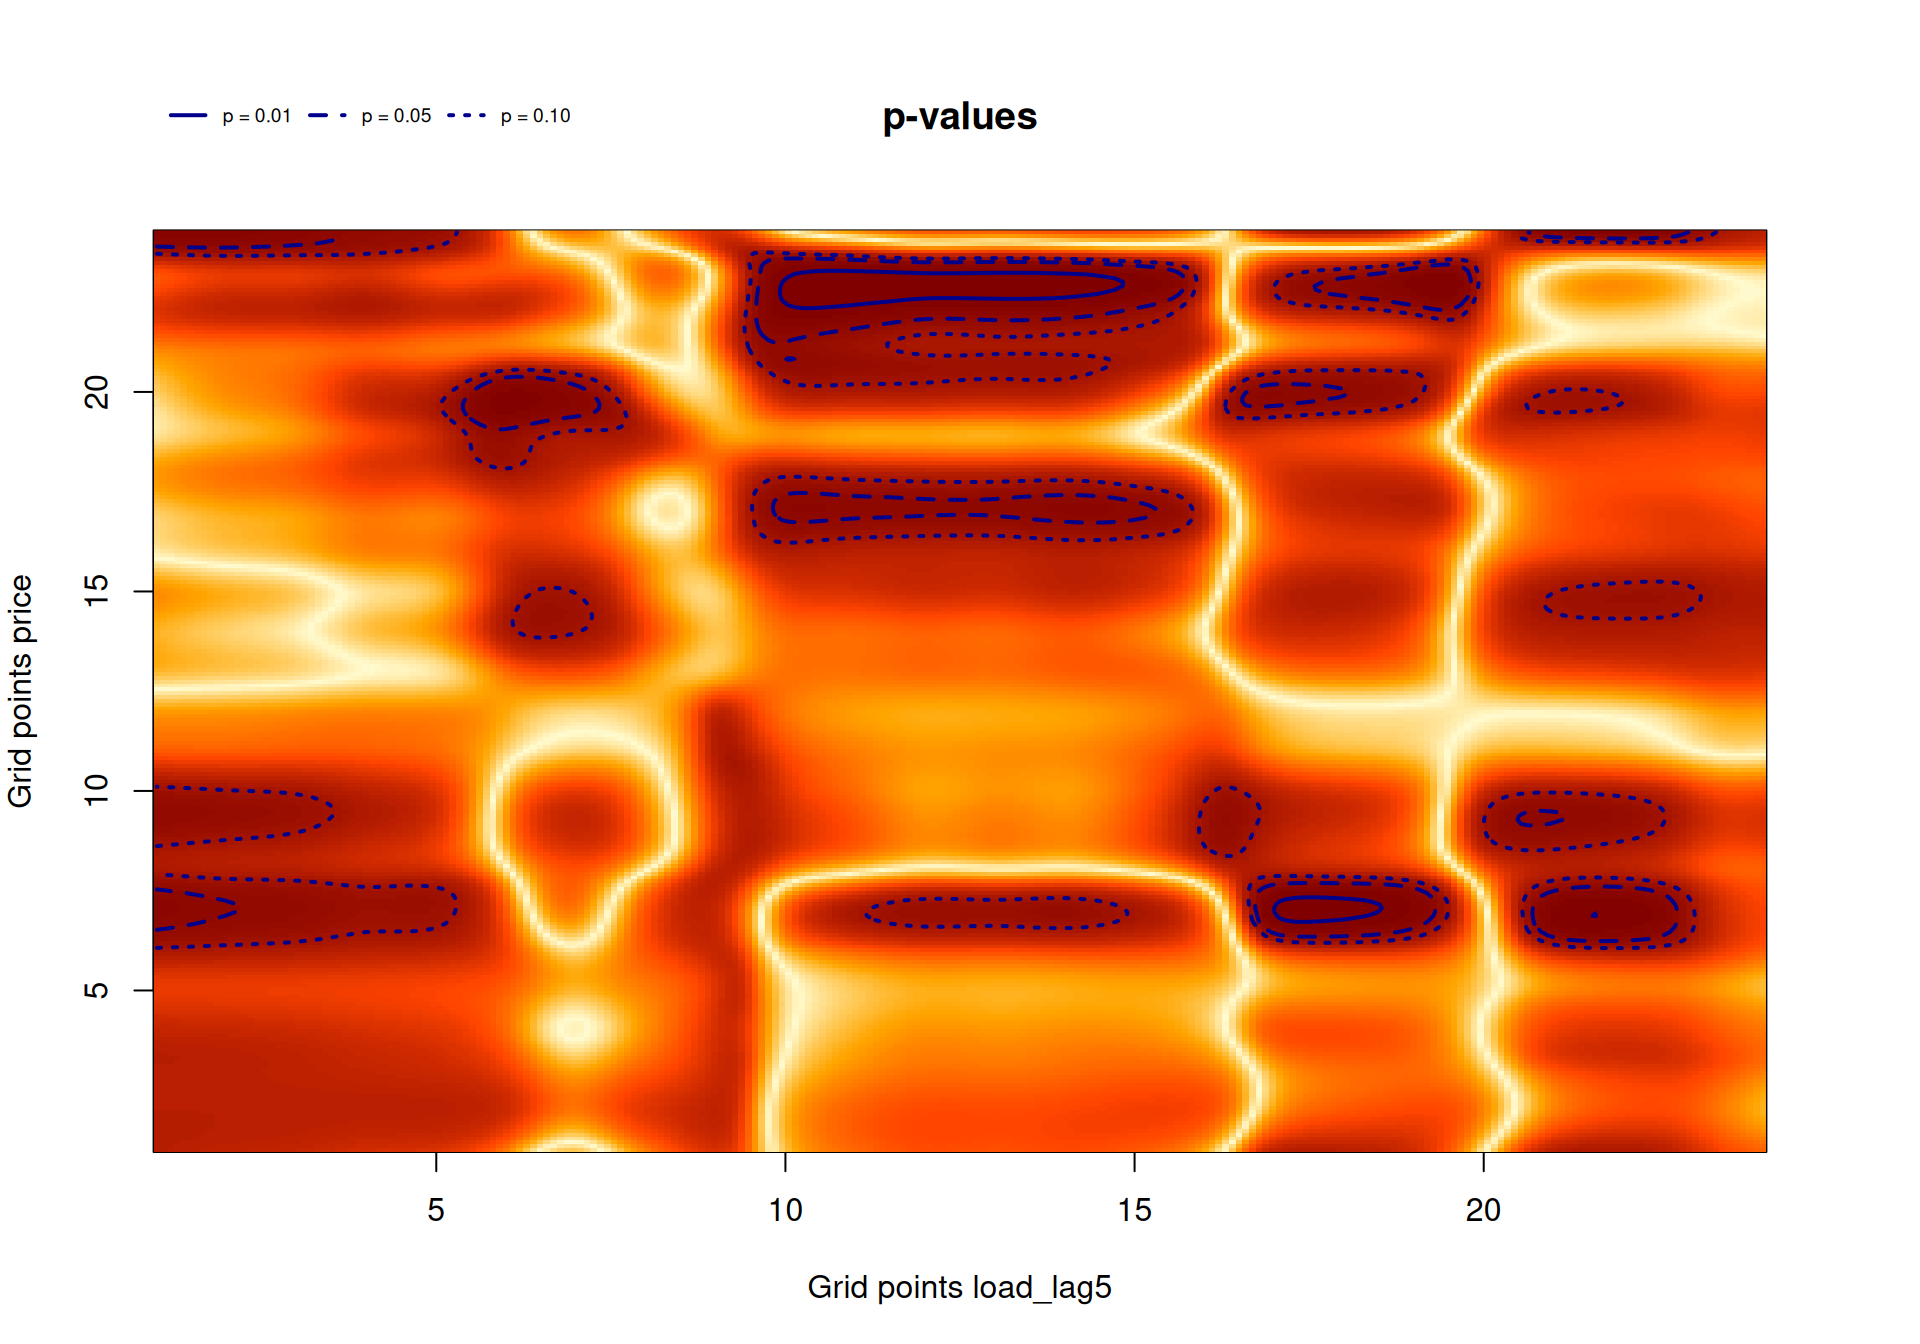
Figure 9: p-values for the one week lagged forecasted electricity load coefficient.
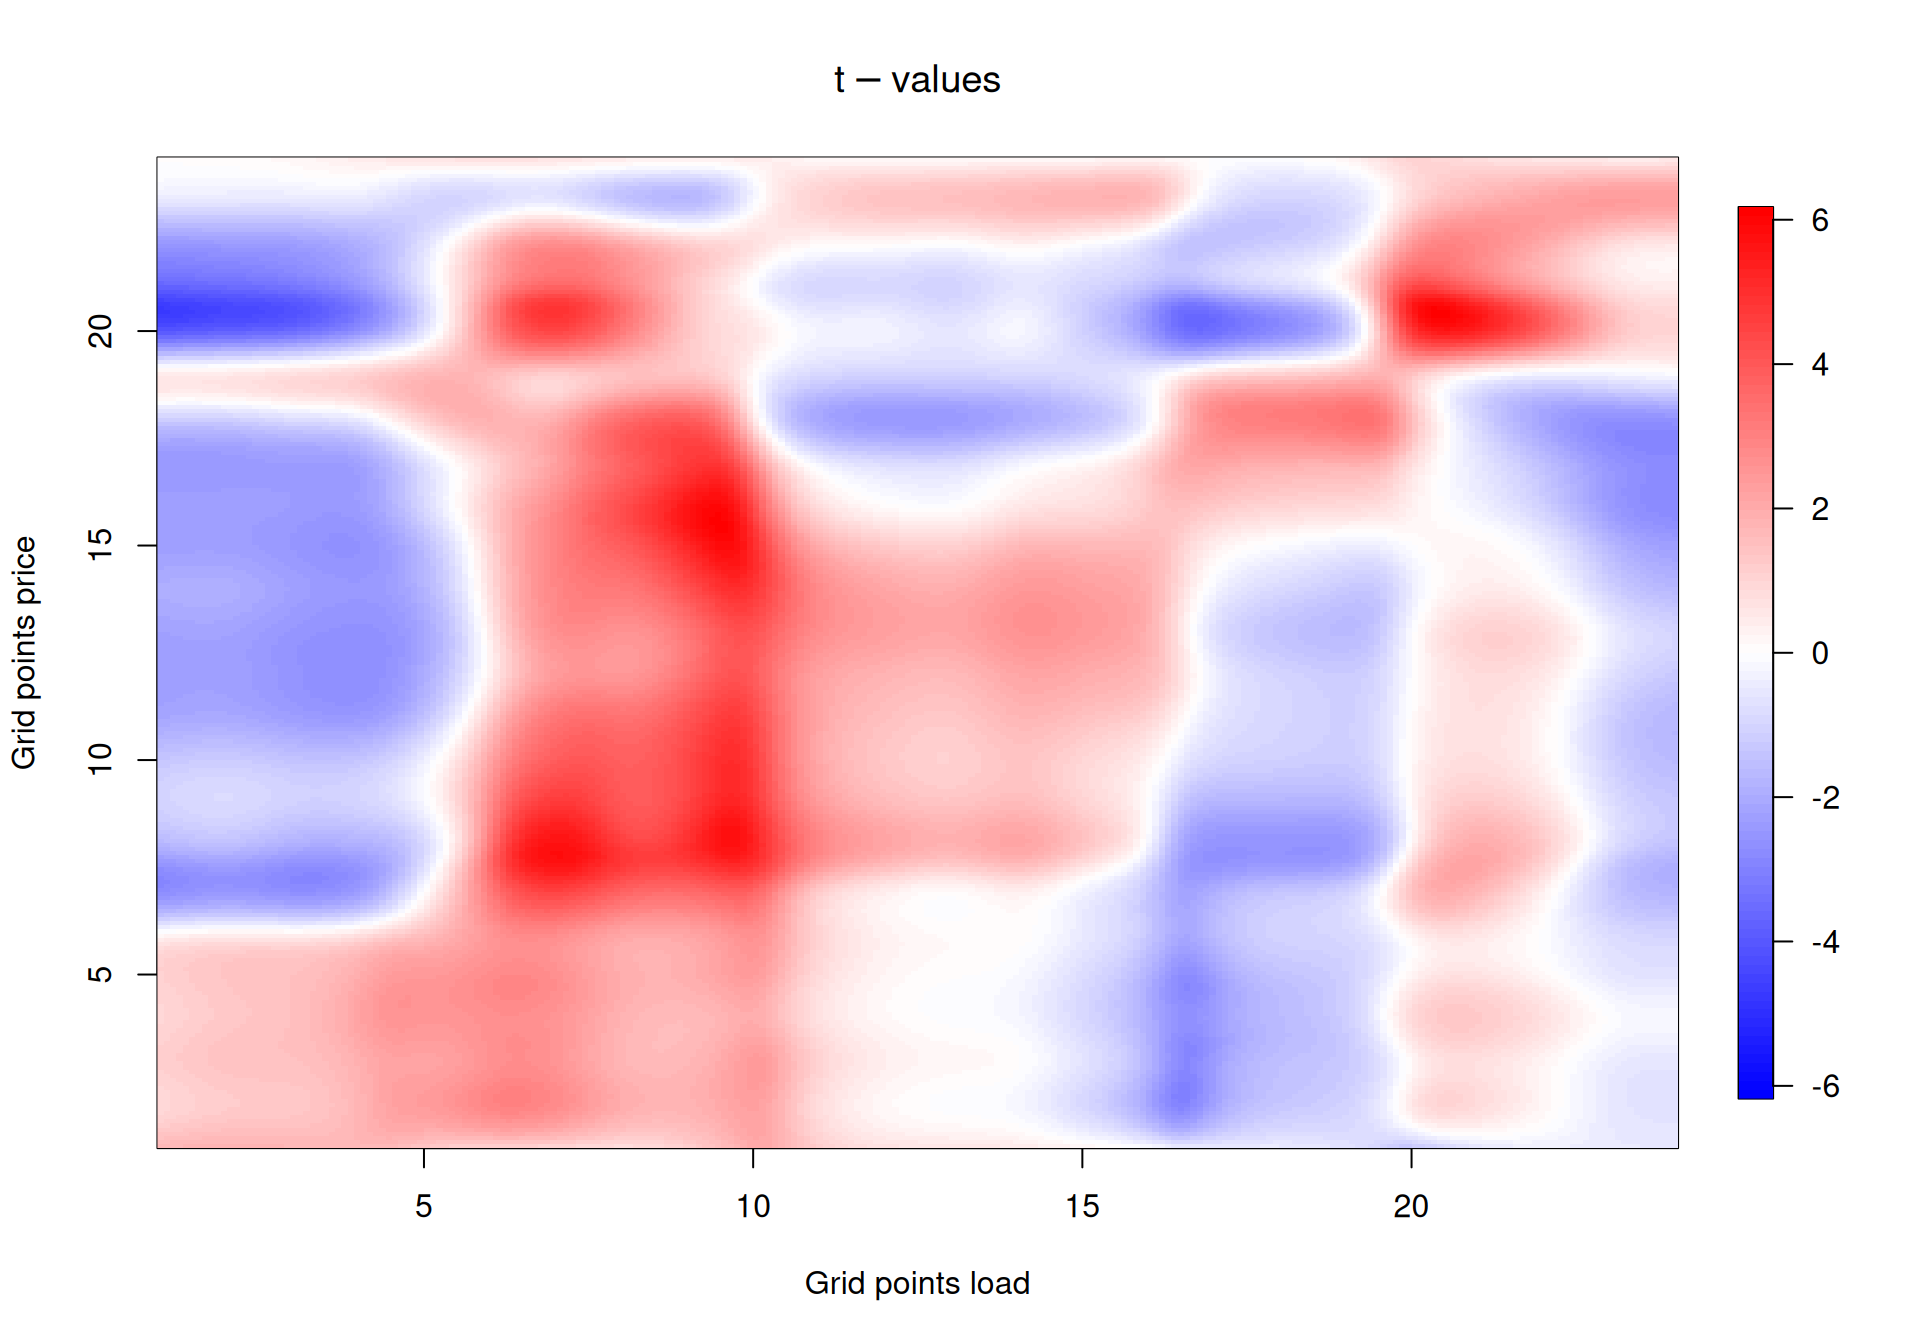
Figure 10: t-values for the forecasted electricity load coefficient.
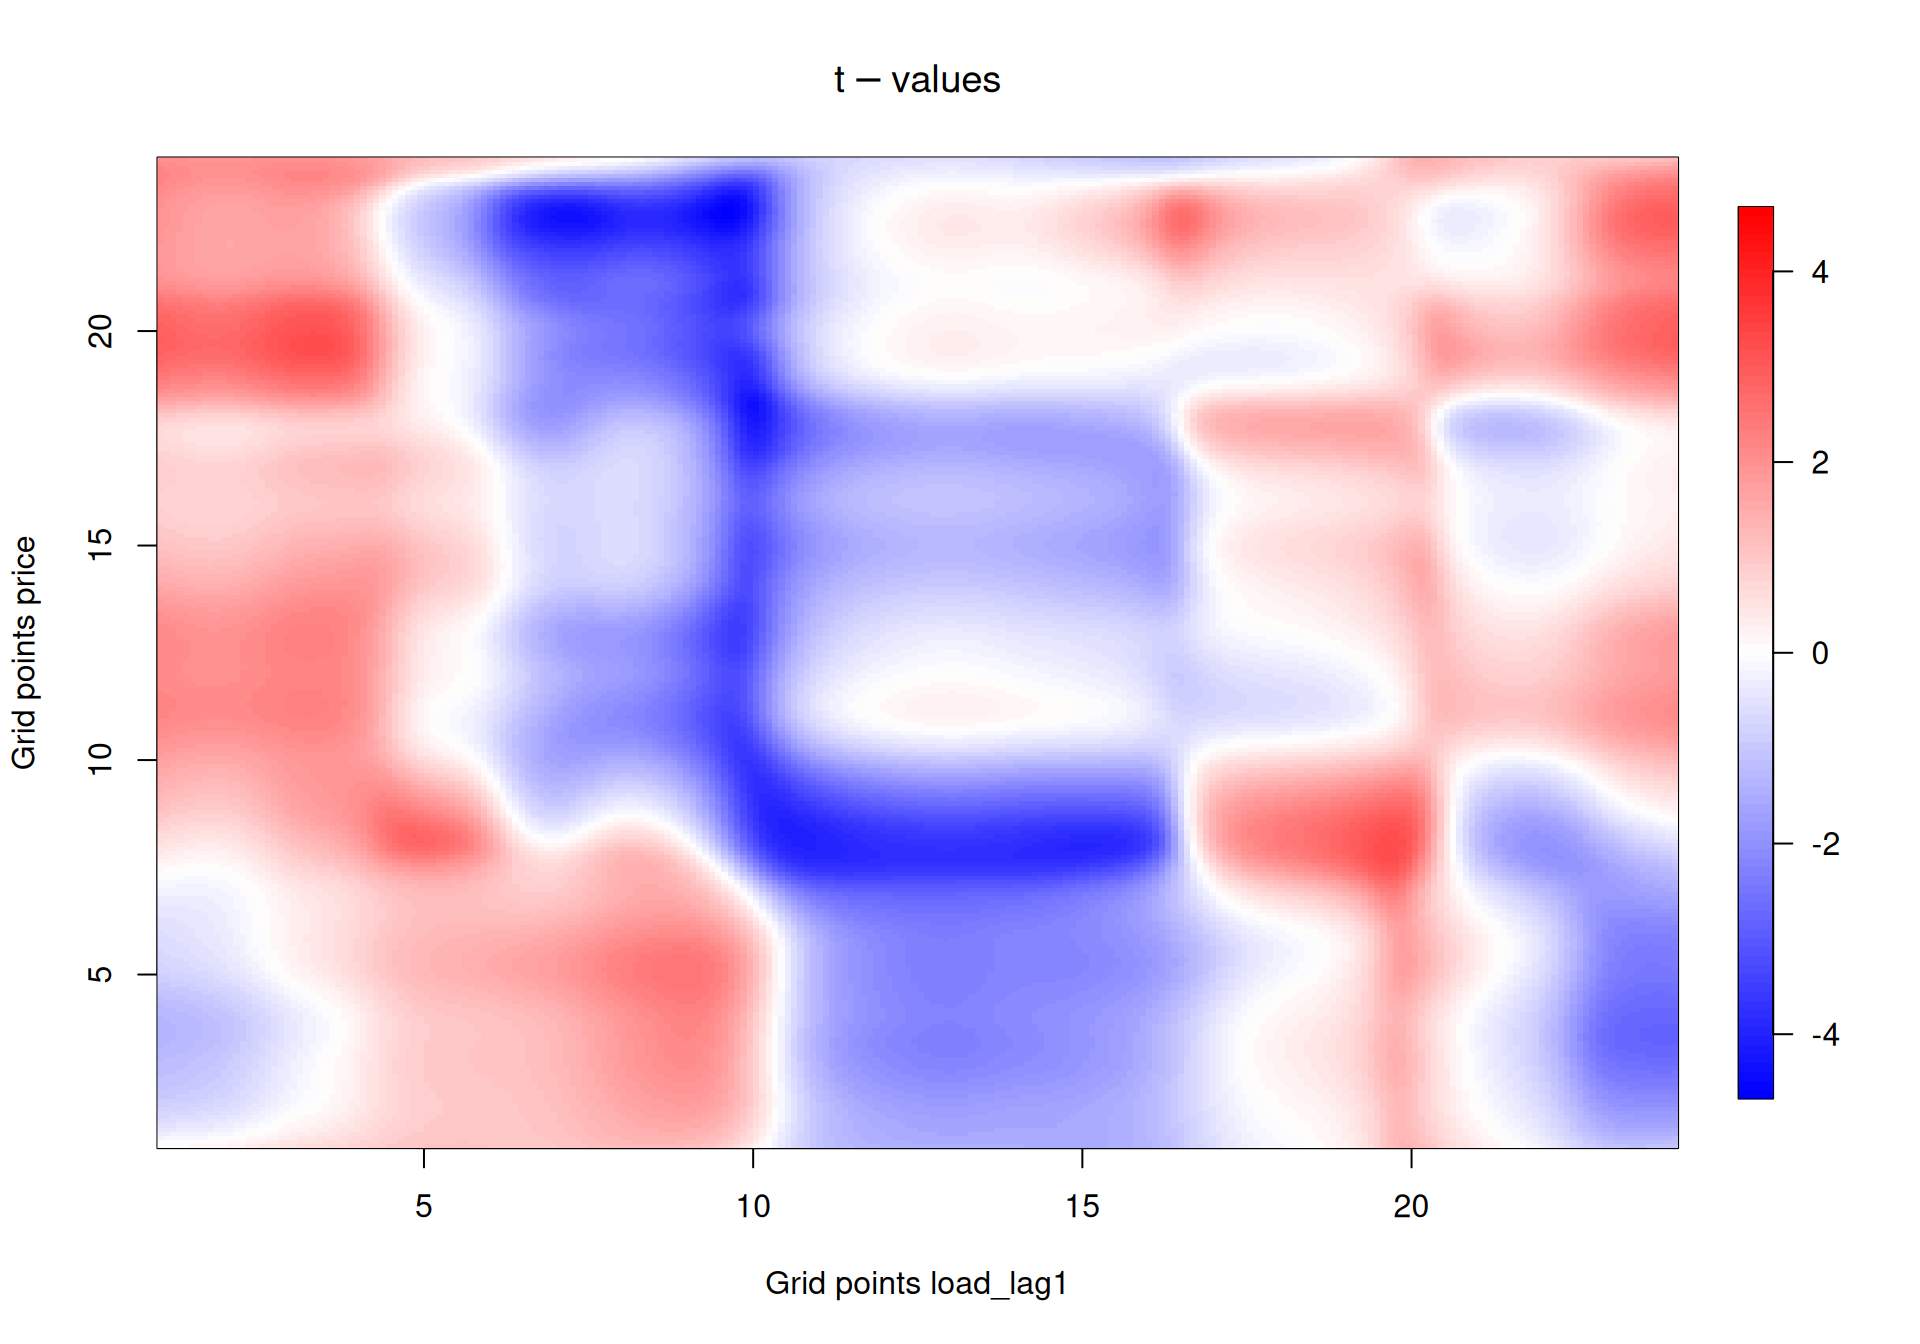
Figure 11: t-values for the one day lagged forecasted electricity load coefficient.
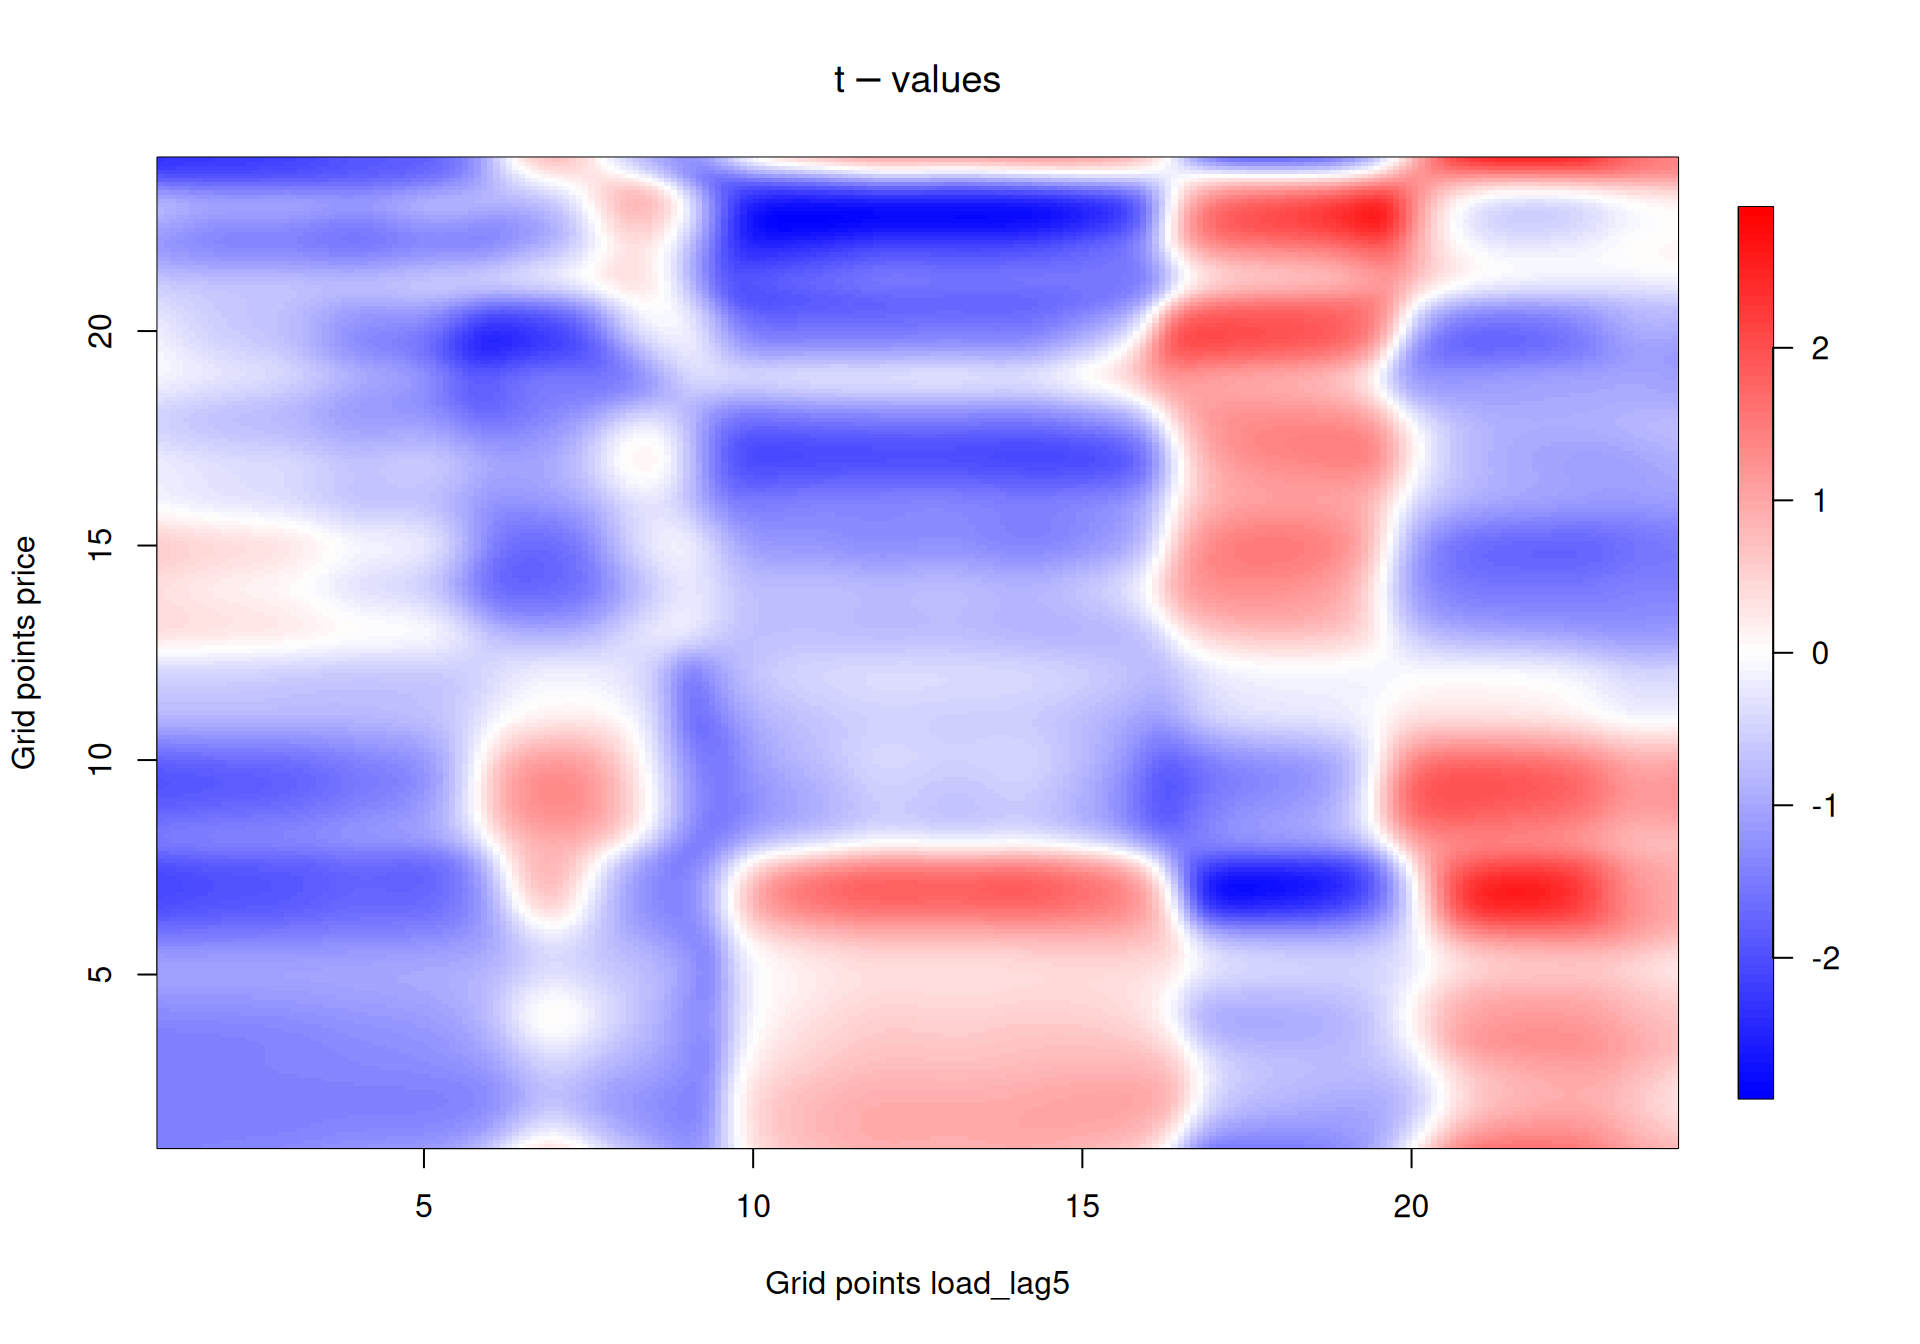
Figure 12: t-values for the one week lagged forecasted electricity load coefficient.
Wind and solar forecast coefficients
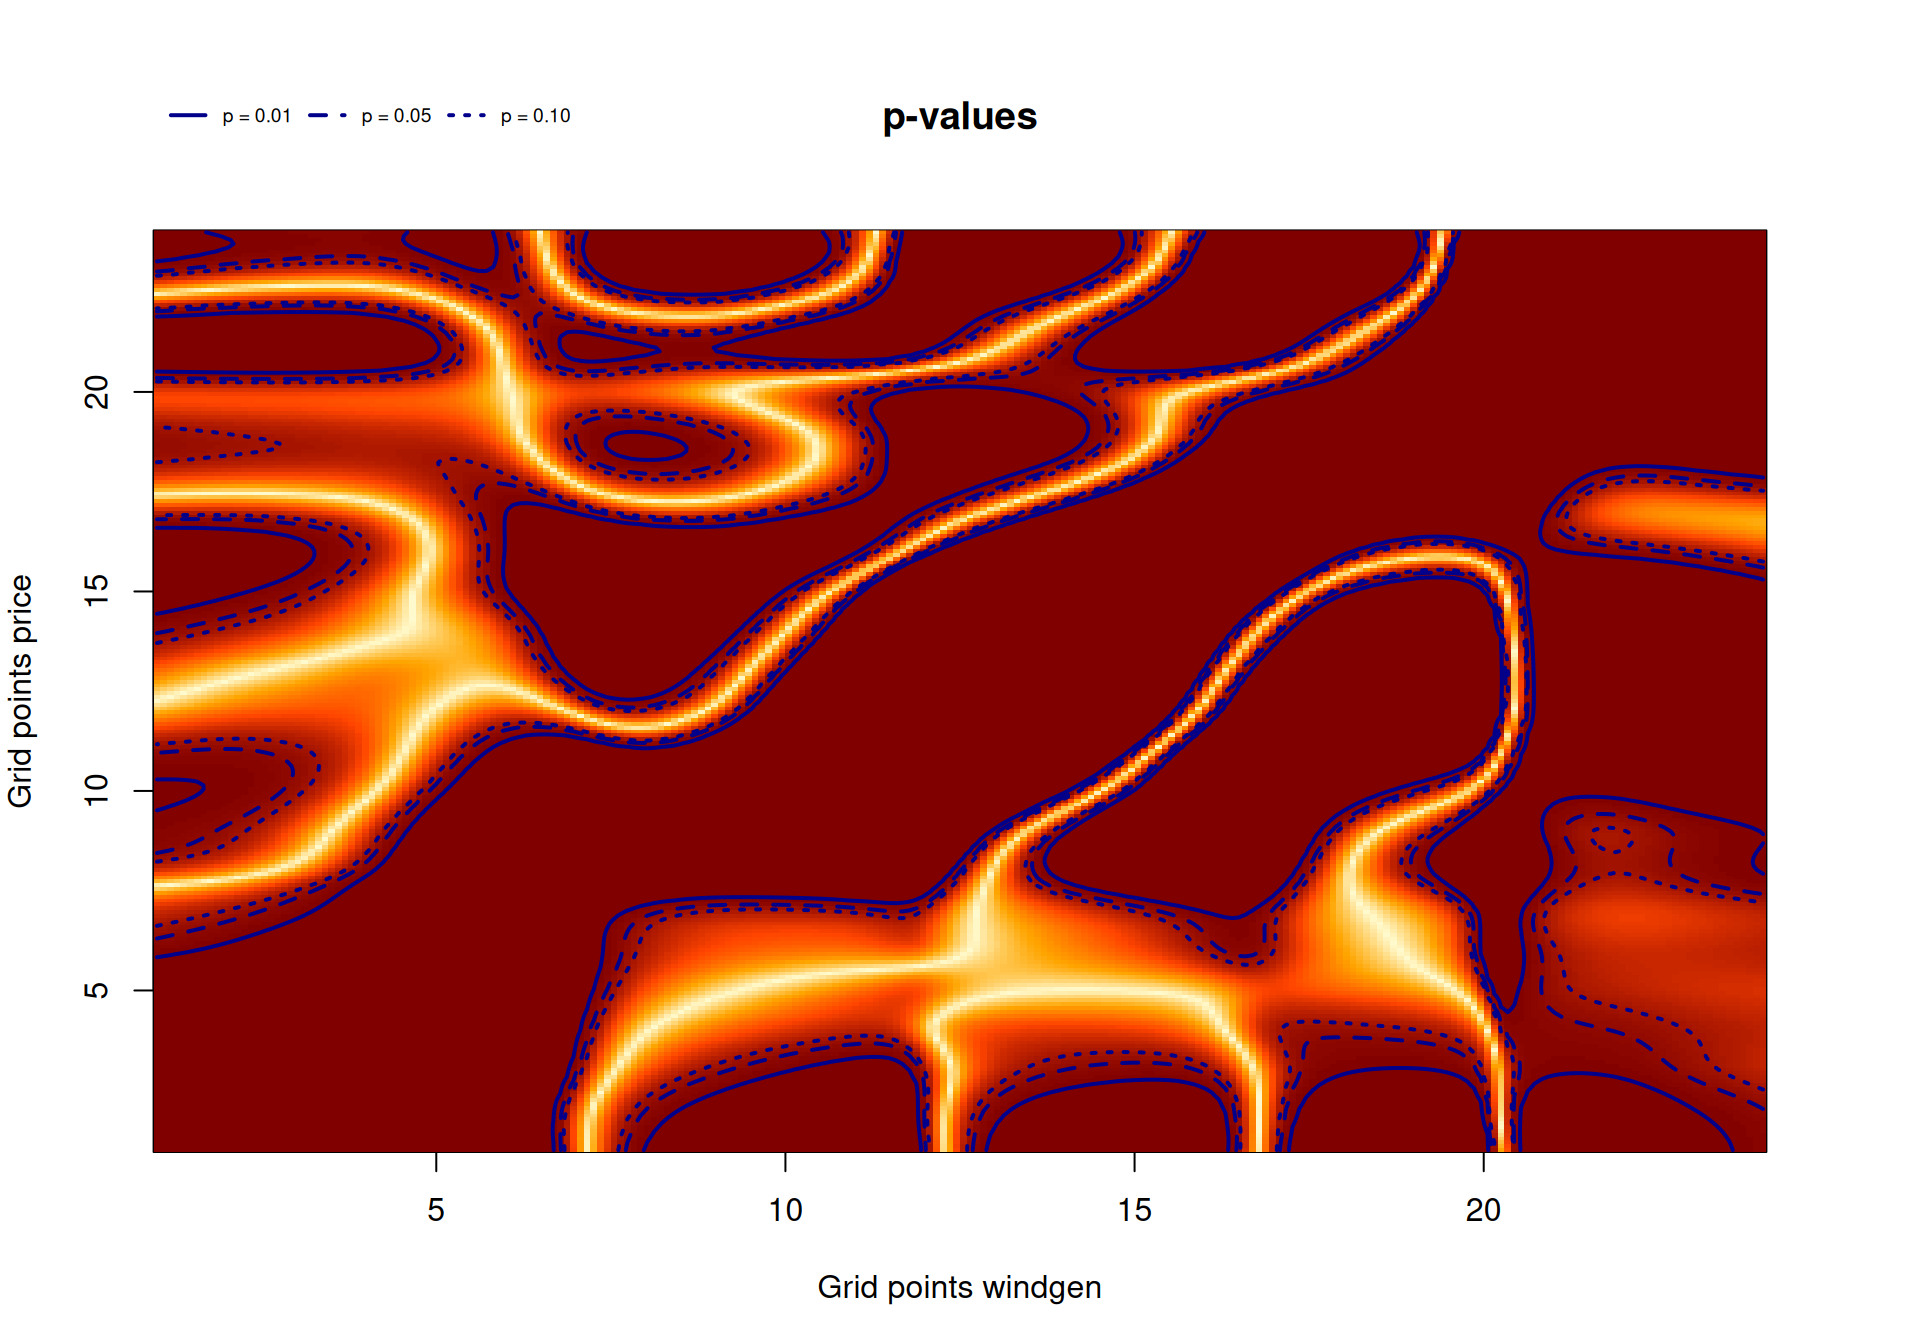
Figure 13: p-values for the forecasted wind and solar generation coefficient.
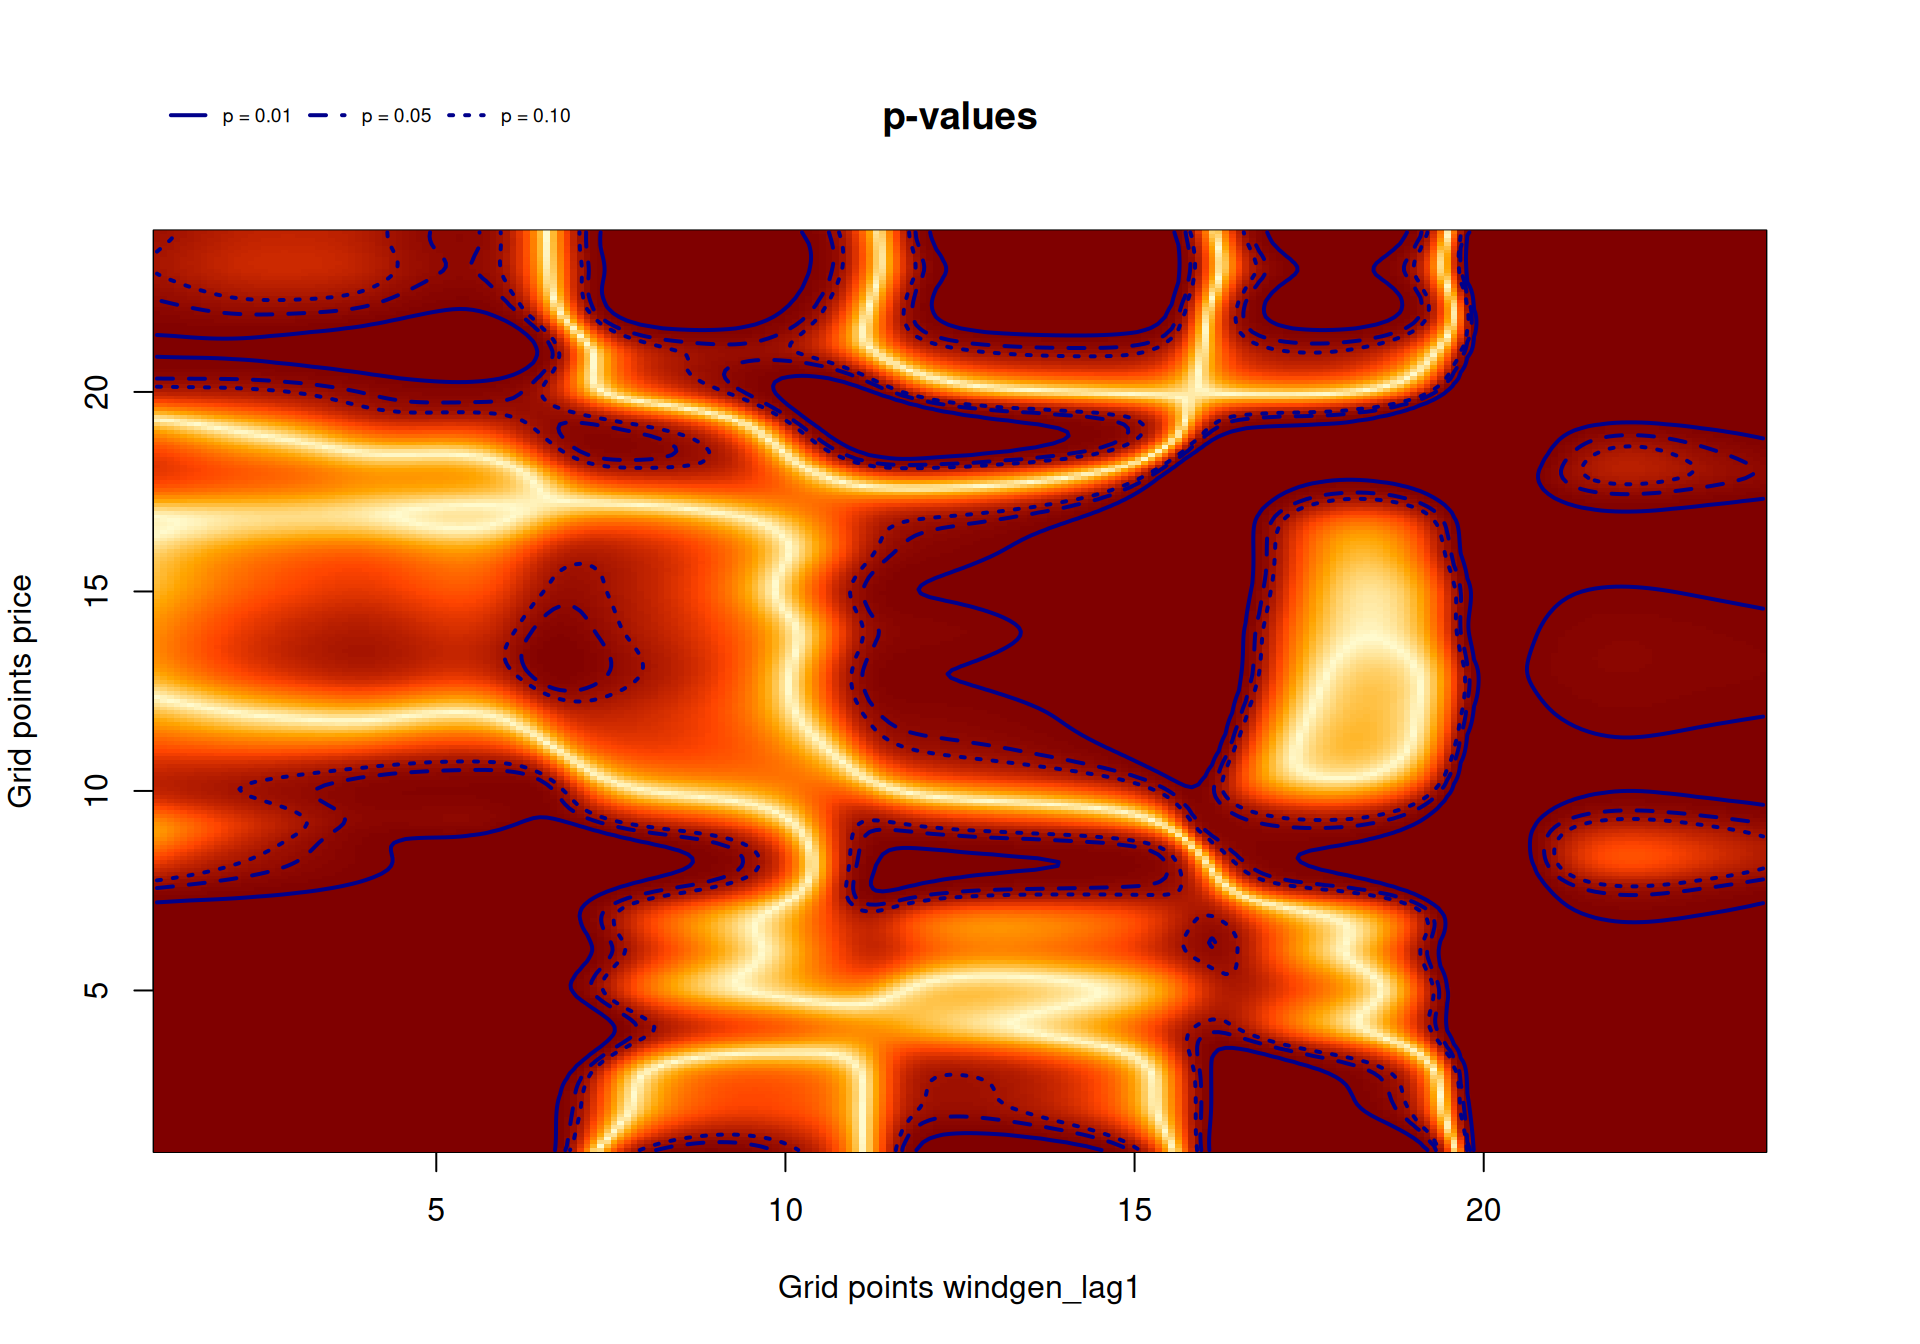
Figure 14: p-values for the one day lagged forecasted wind and solar generation coefficient.
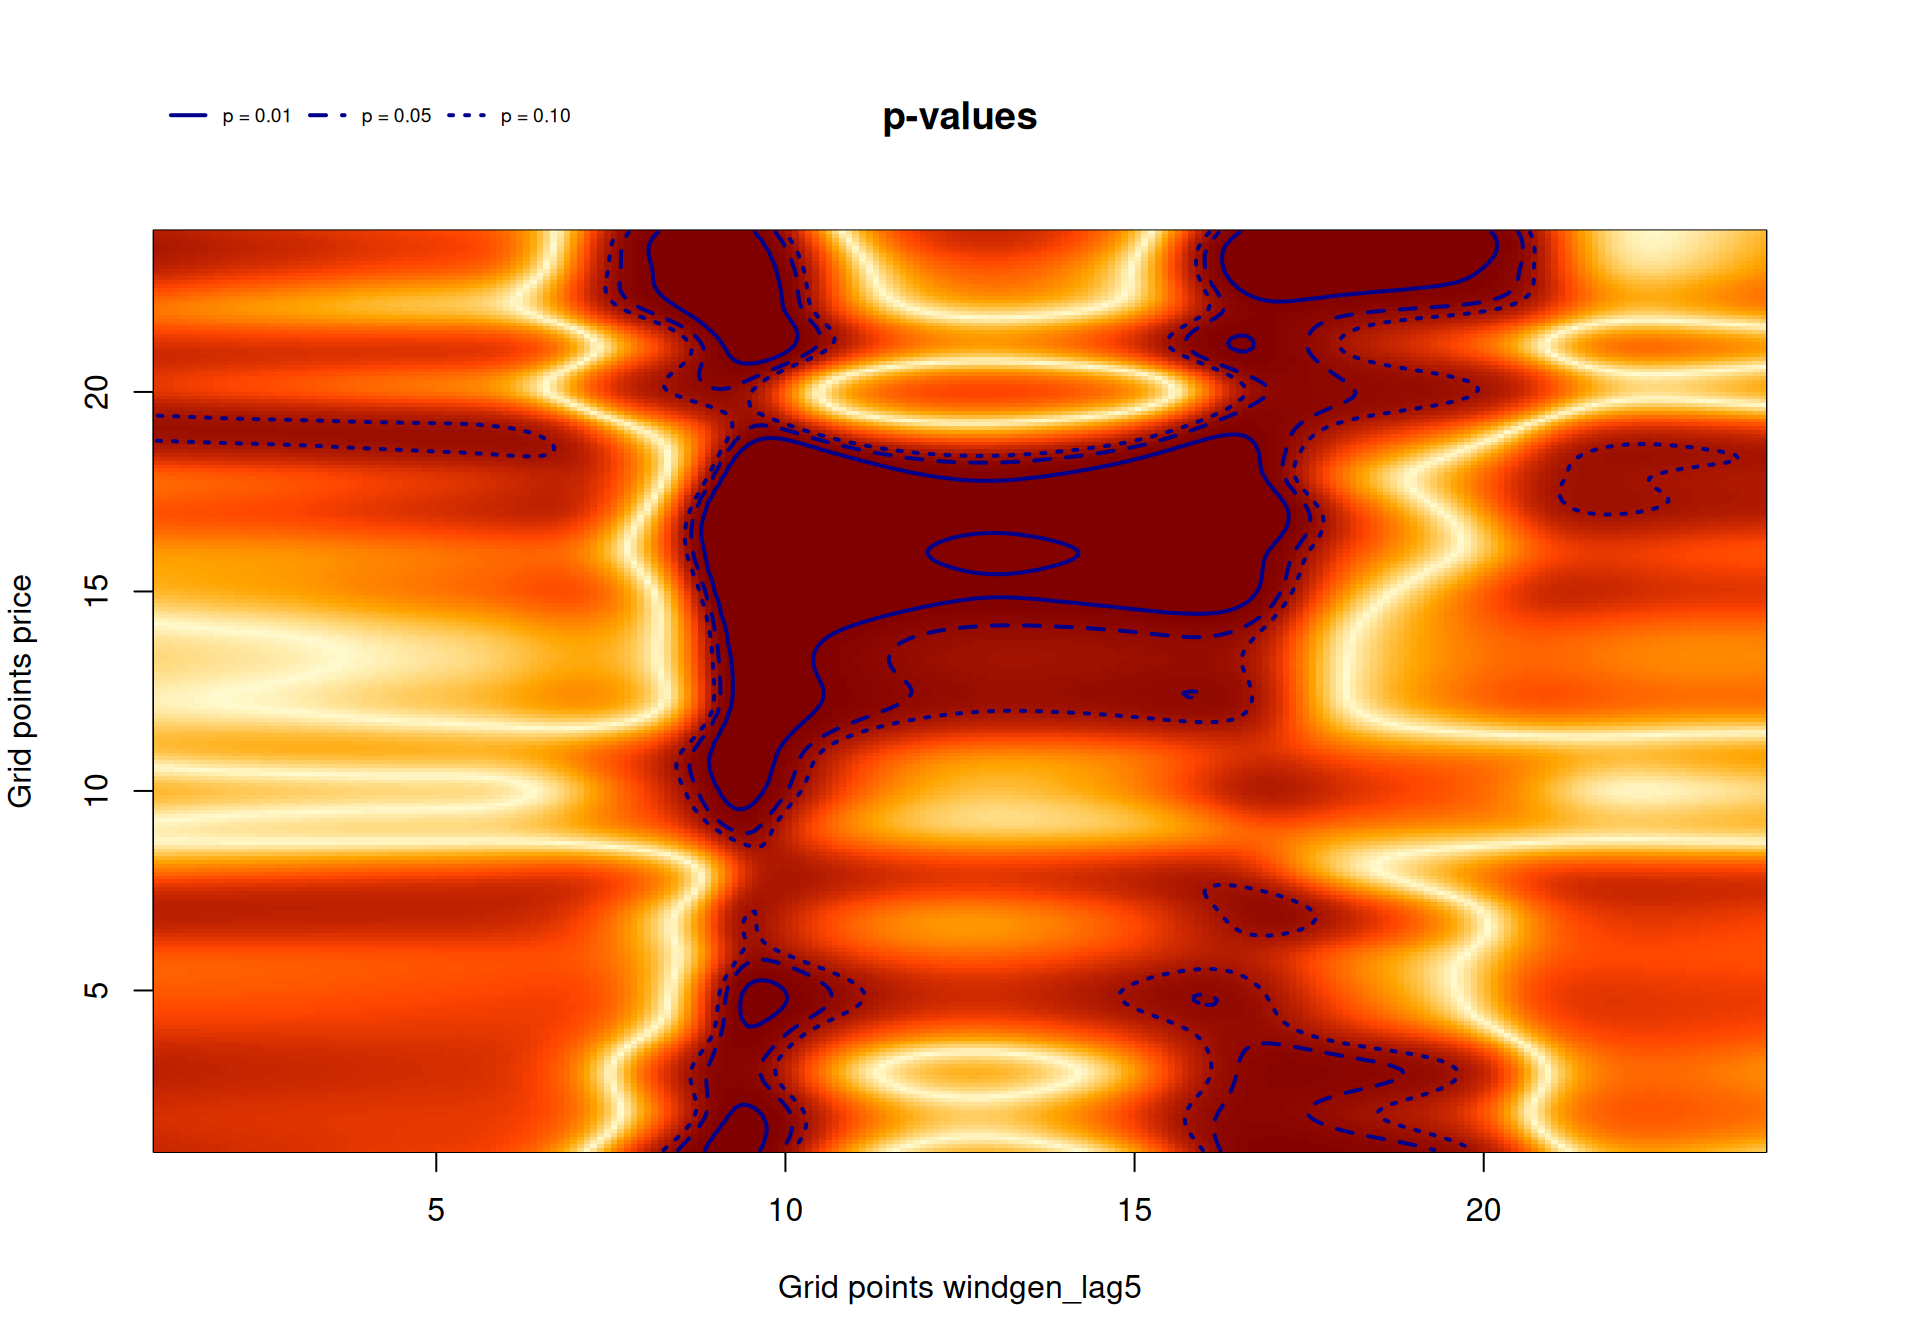
Figure 15: p-values for the one week lagged forecasted wind and solar generation coefficient.
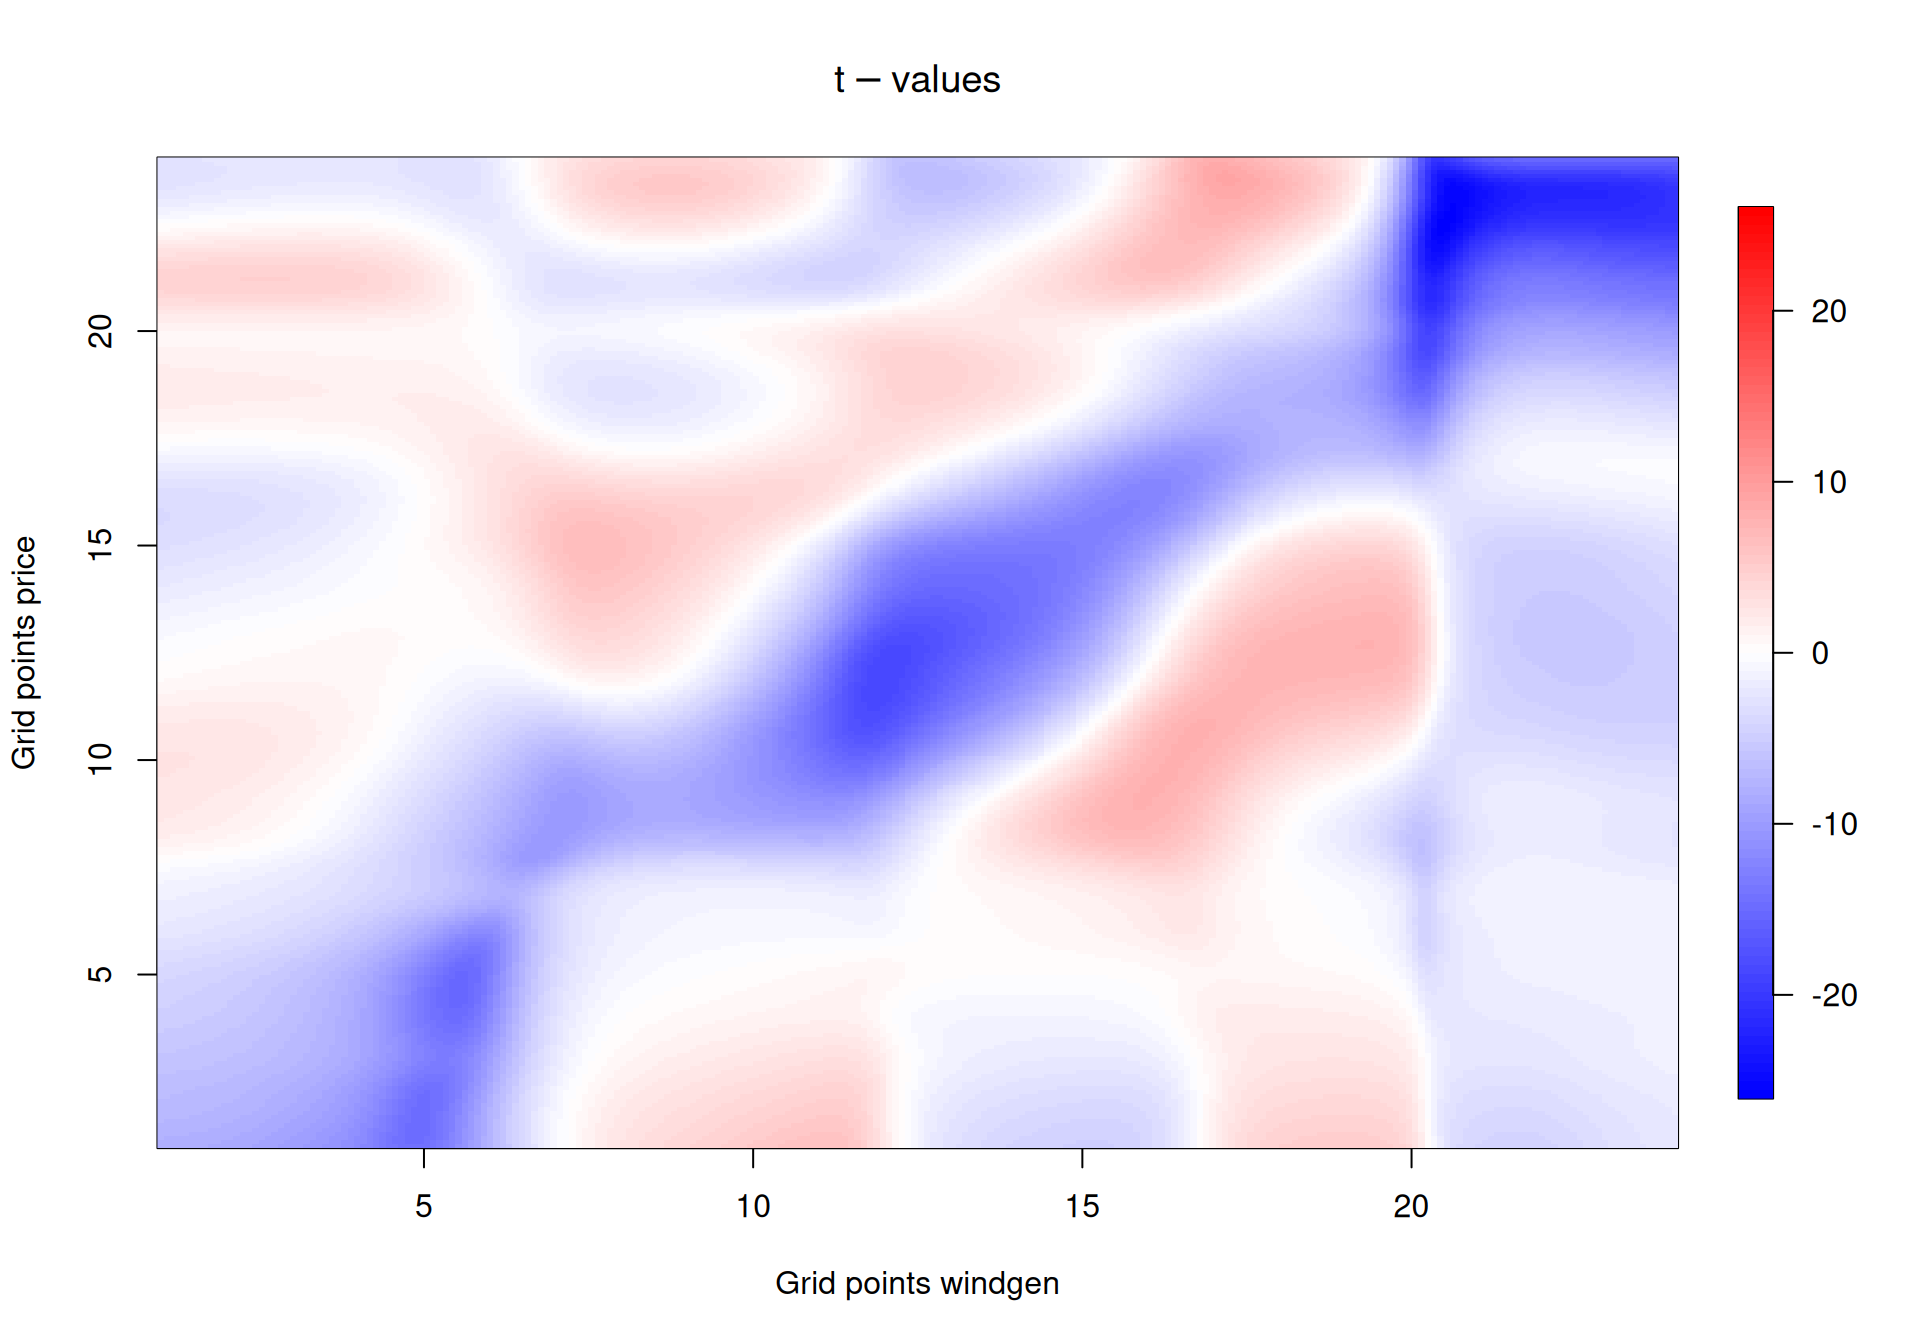
Figure 16: t-values for the forecasted wind and solar generation coefficient.
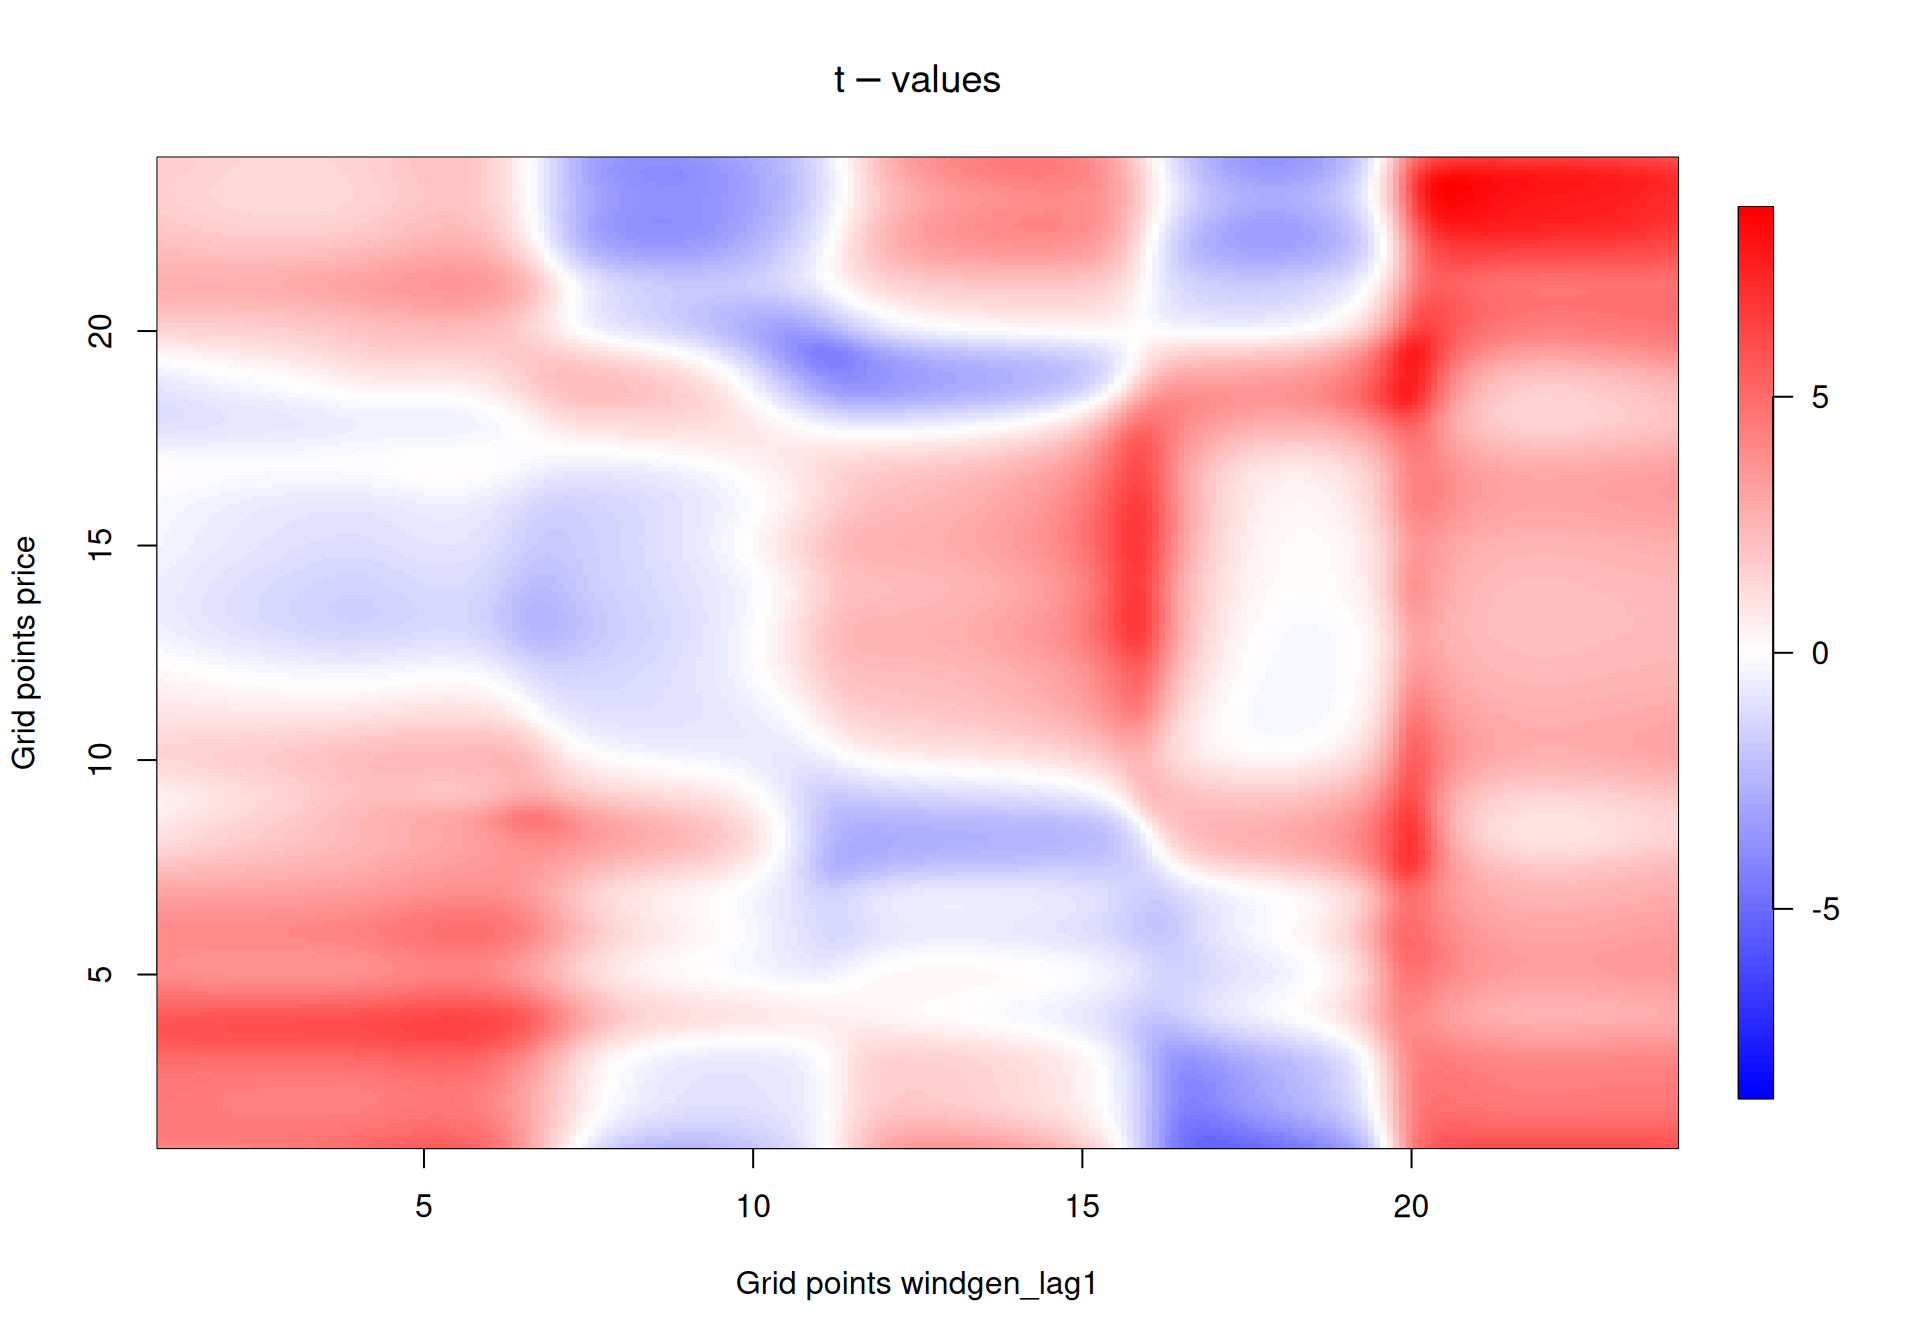
Figure 17: t-values for the one day lagged forecasted wind and solar generation coefficient.
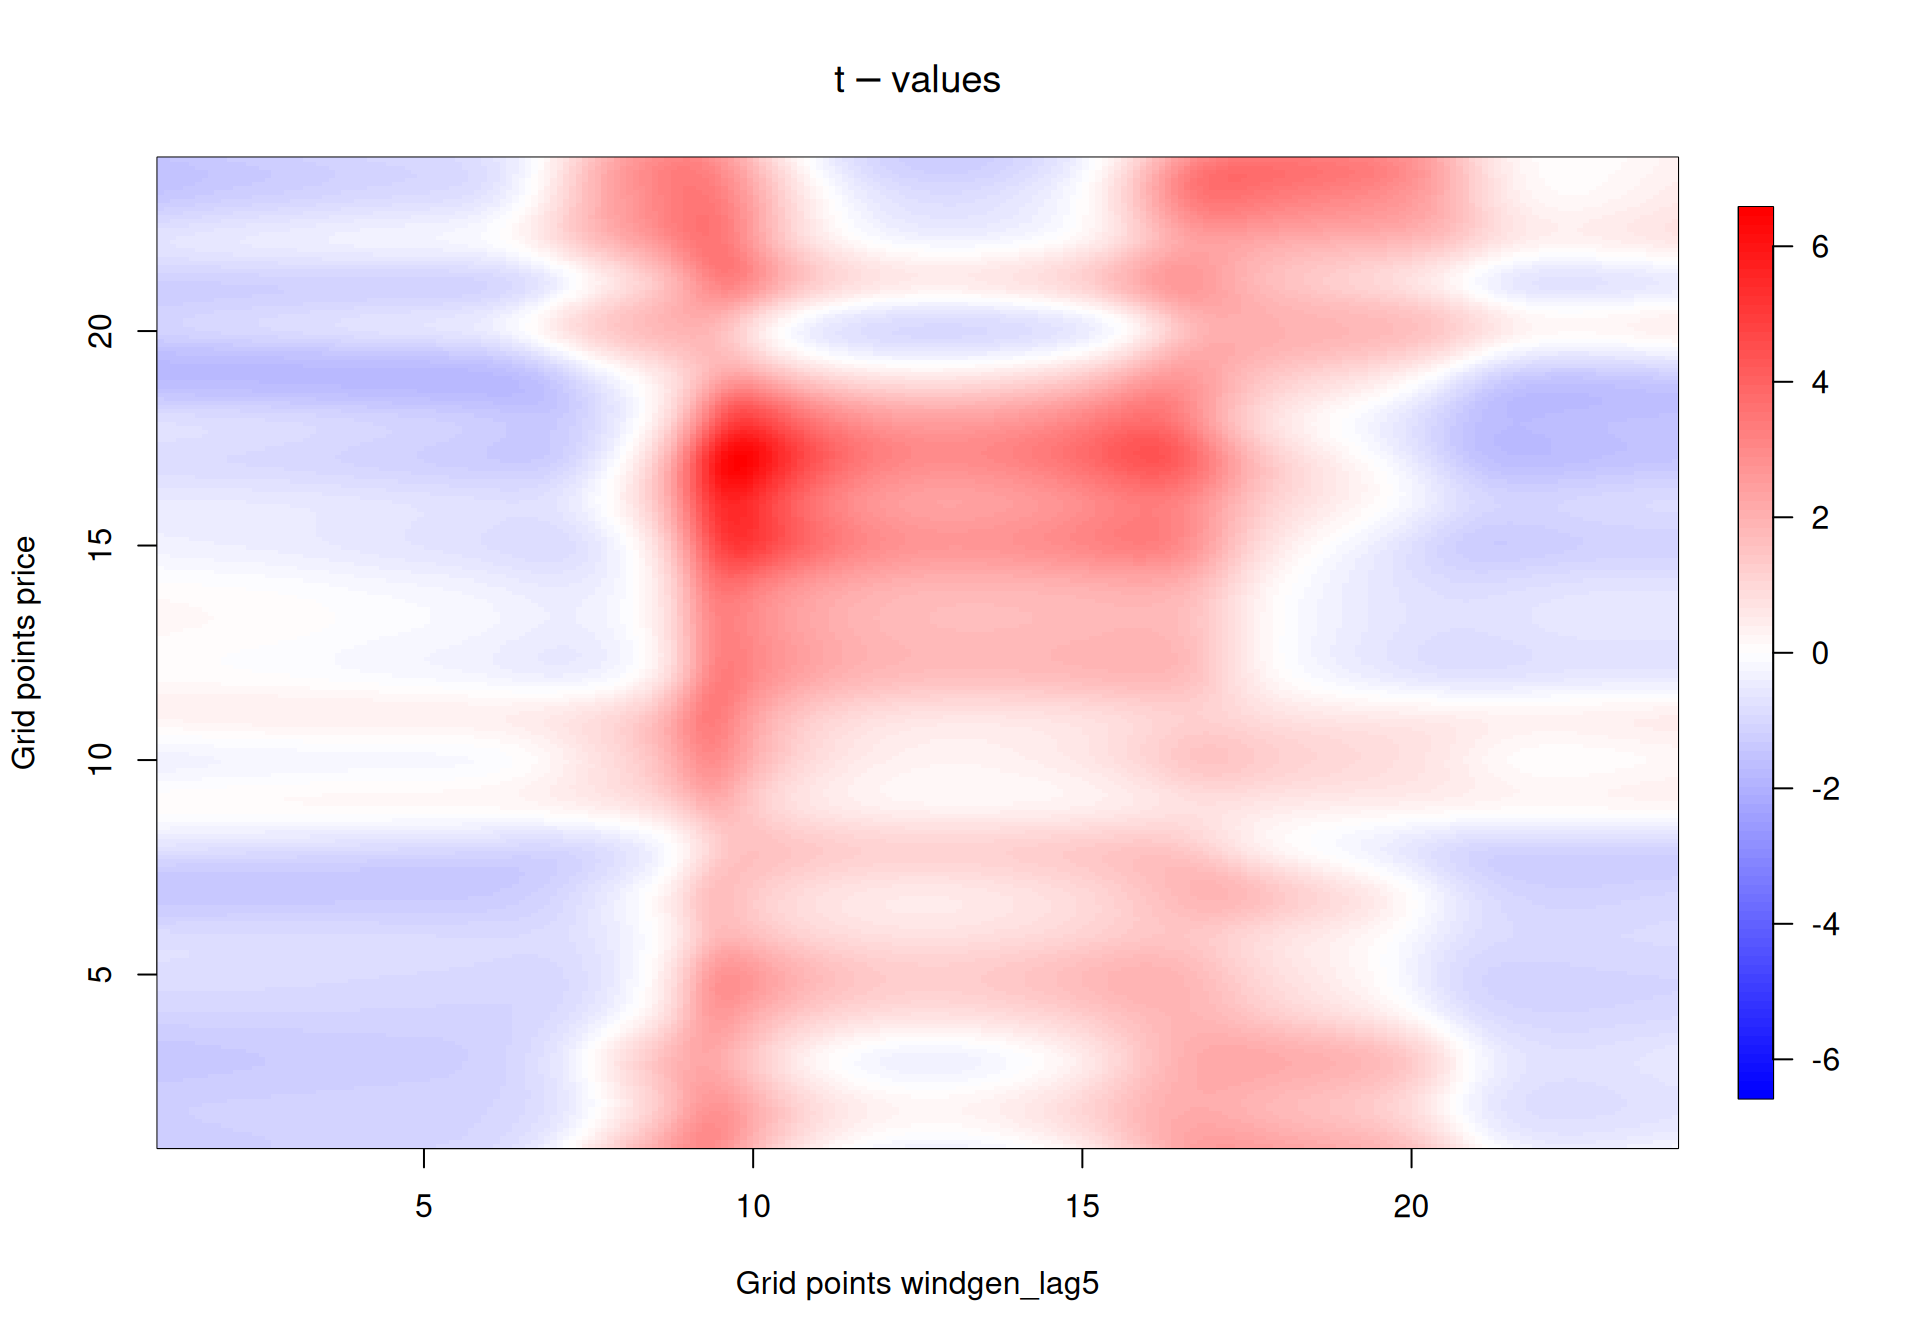
Figure 18: t-values for the one week lagged forecasted wind and solar generation coefficient.