Beta coefficients (2D)
Overview
Beta coefficients in function-on-function regression represent how the predictor function at each point affects the response function at each point. The heatmaps below visualize these bivariate coefficient surfaces for each functional predictor.
Price lag coefficients
The plots below show how the previous days’ electricity prices influence current prices throughout the day. The x-axis represents the time of day for the lagged price, while the y-axis represents the time of day for the current price.
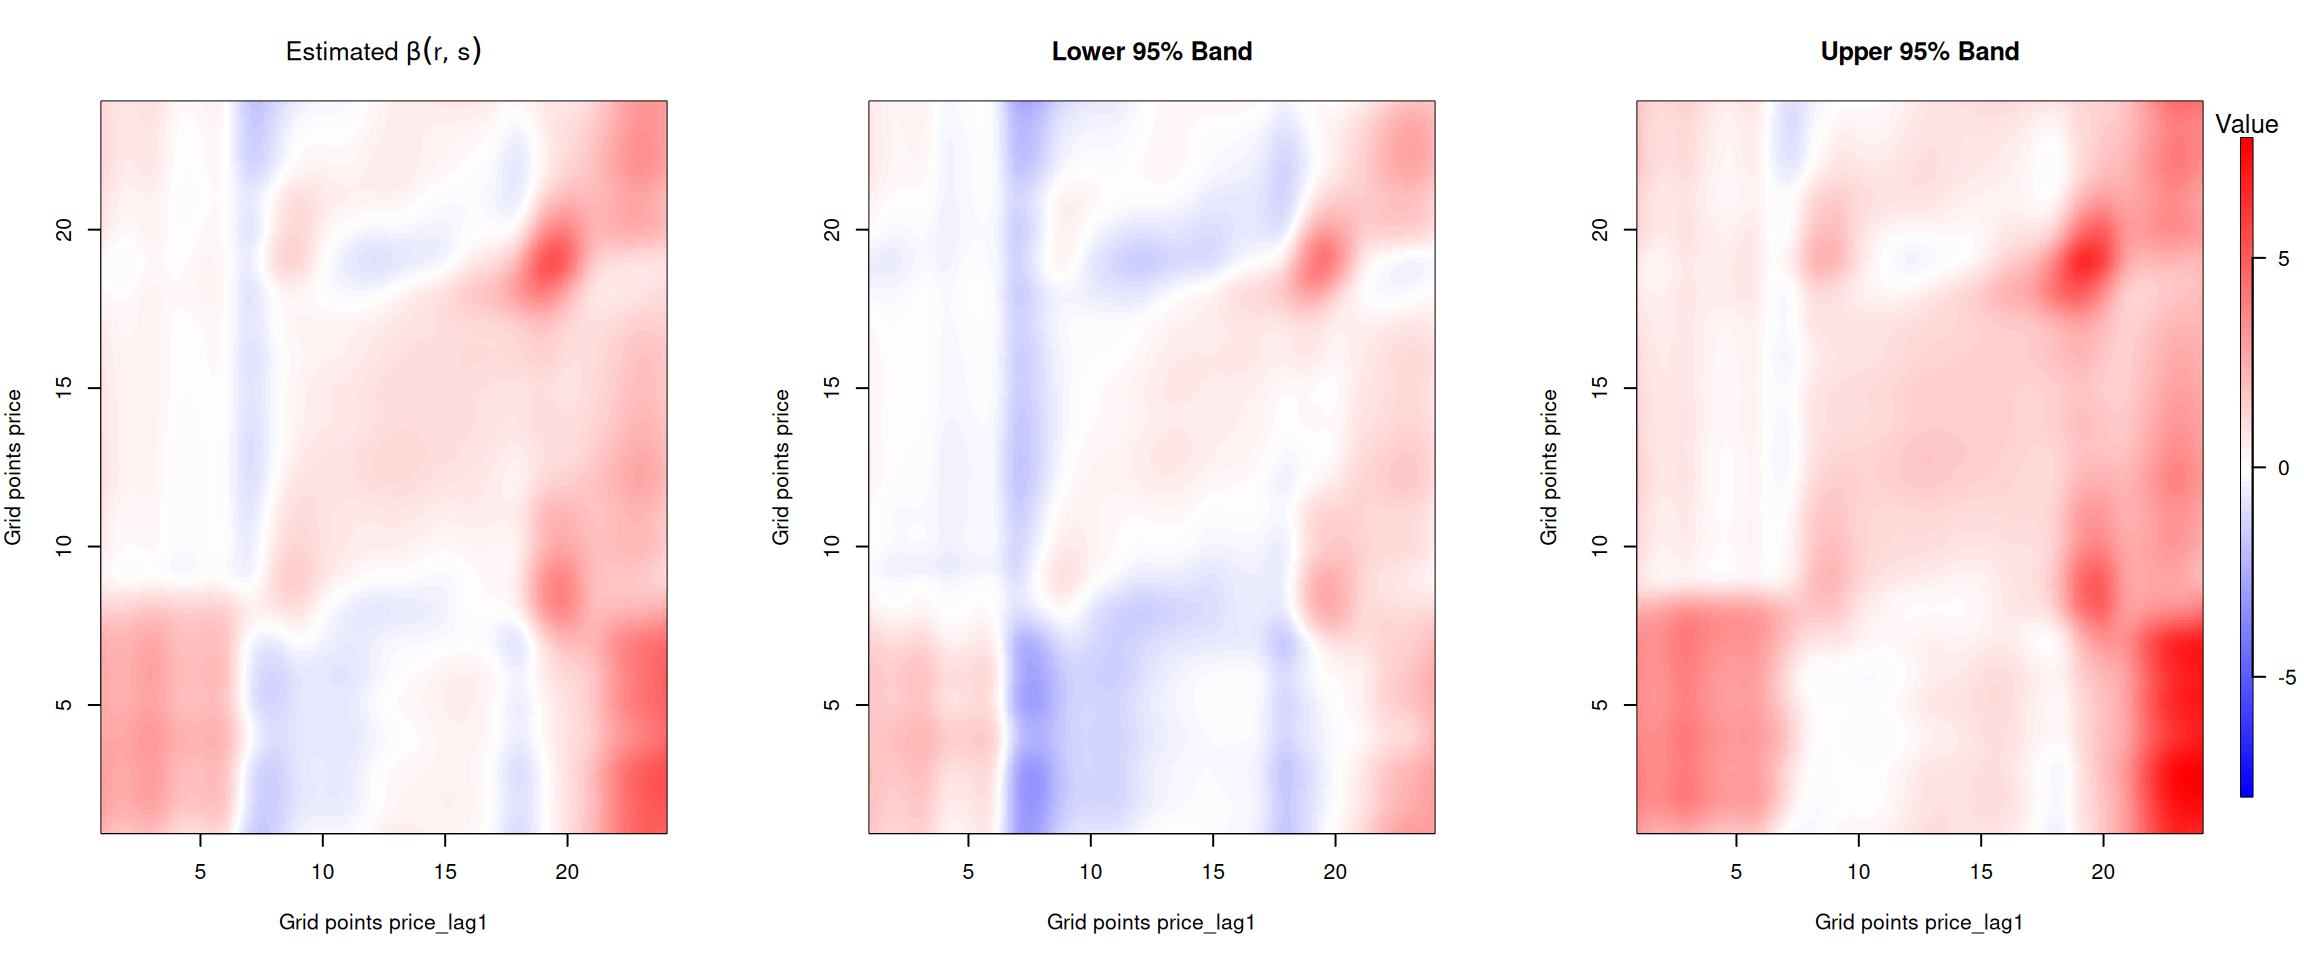
Figure 1: Beta coefficient for the one day lagged price.
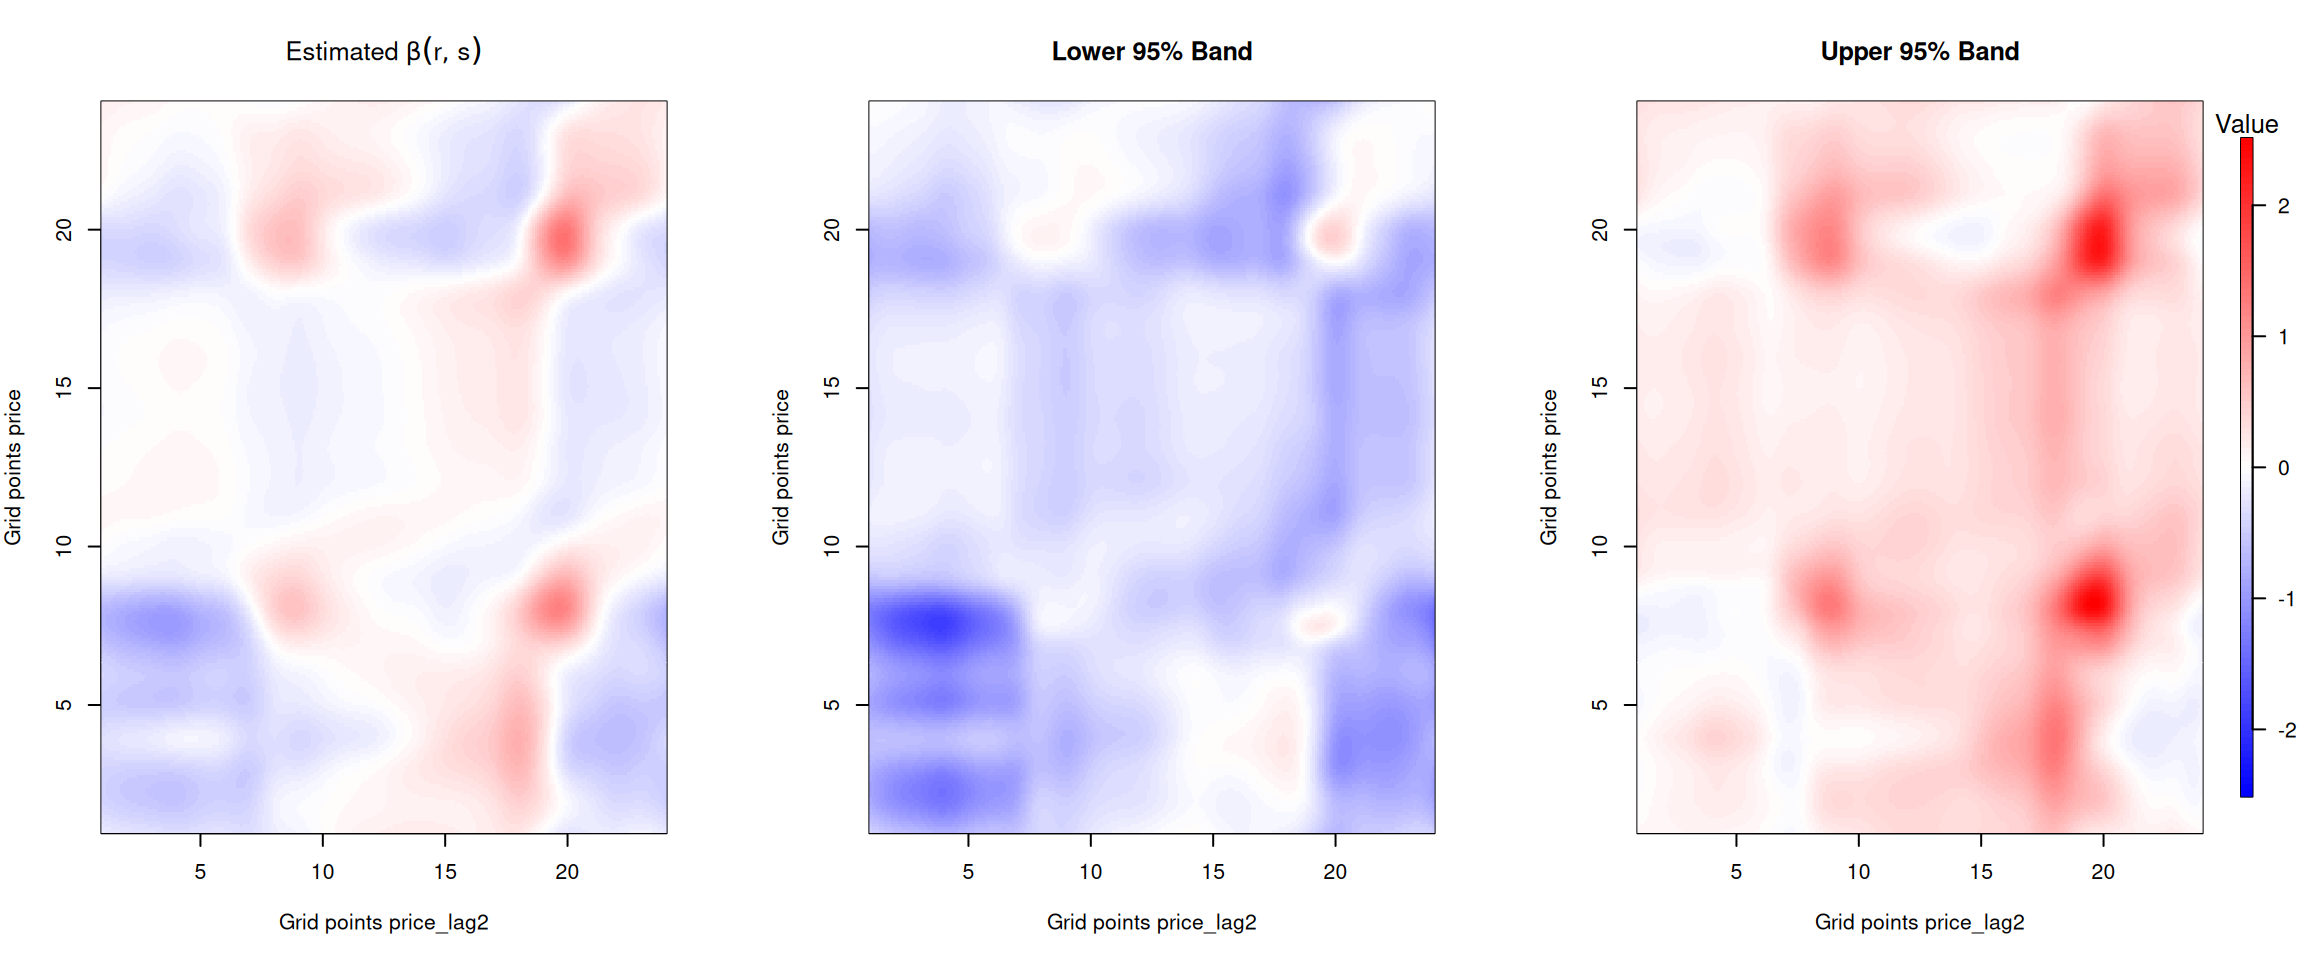
Figure 2: Beta coefficient for the two days lagged price.
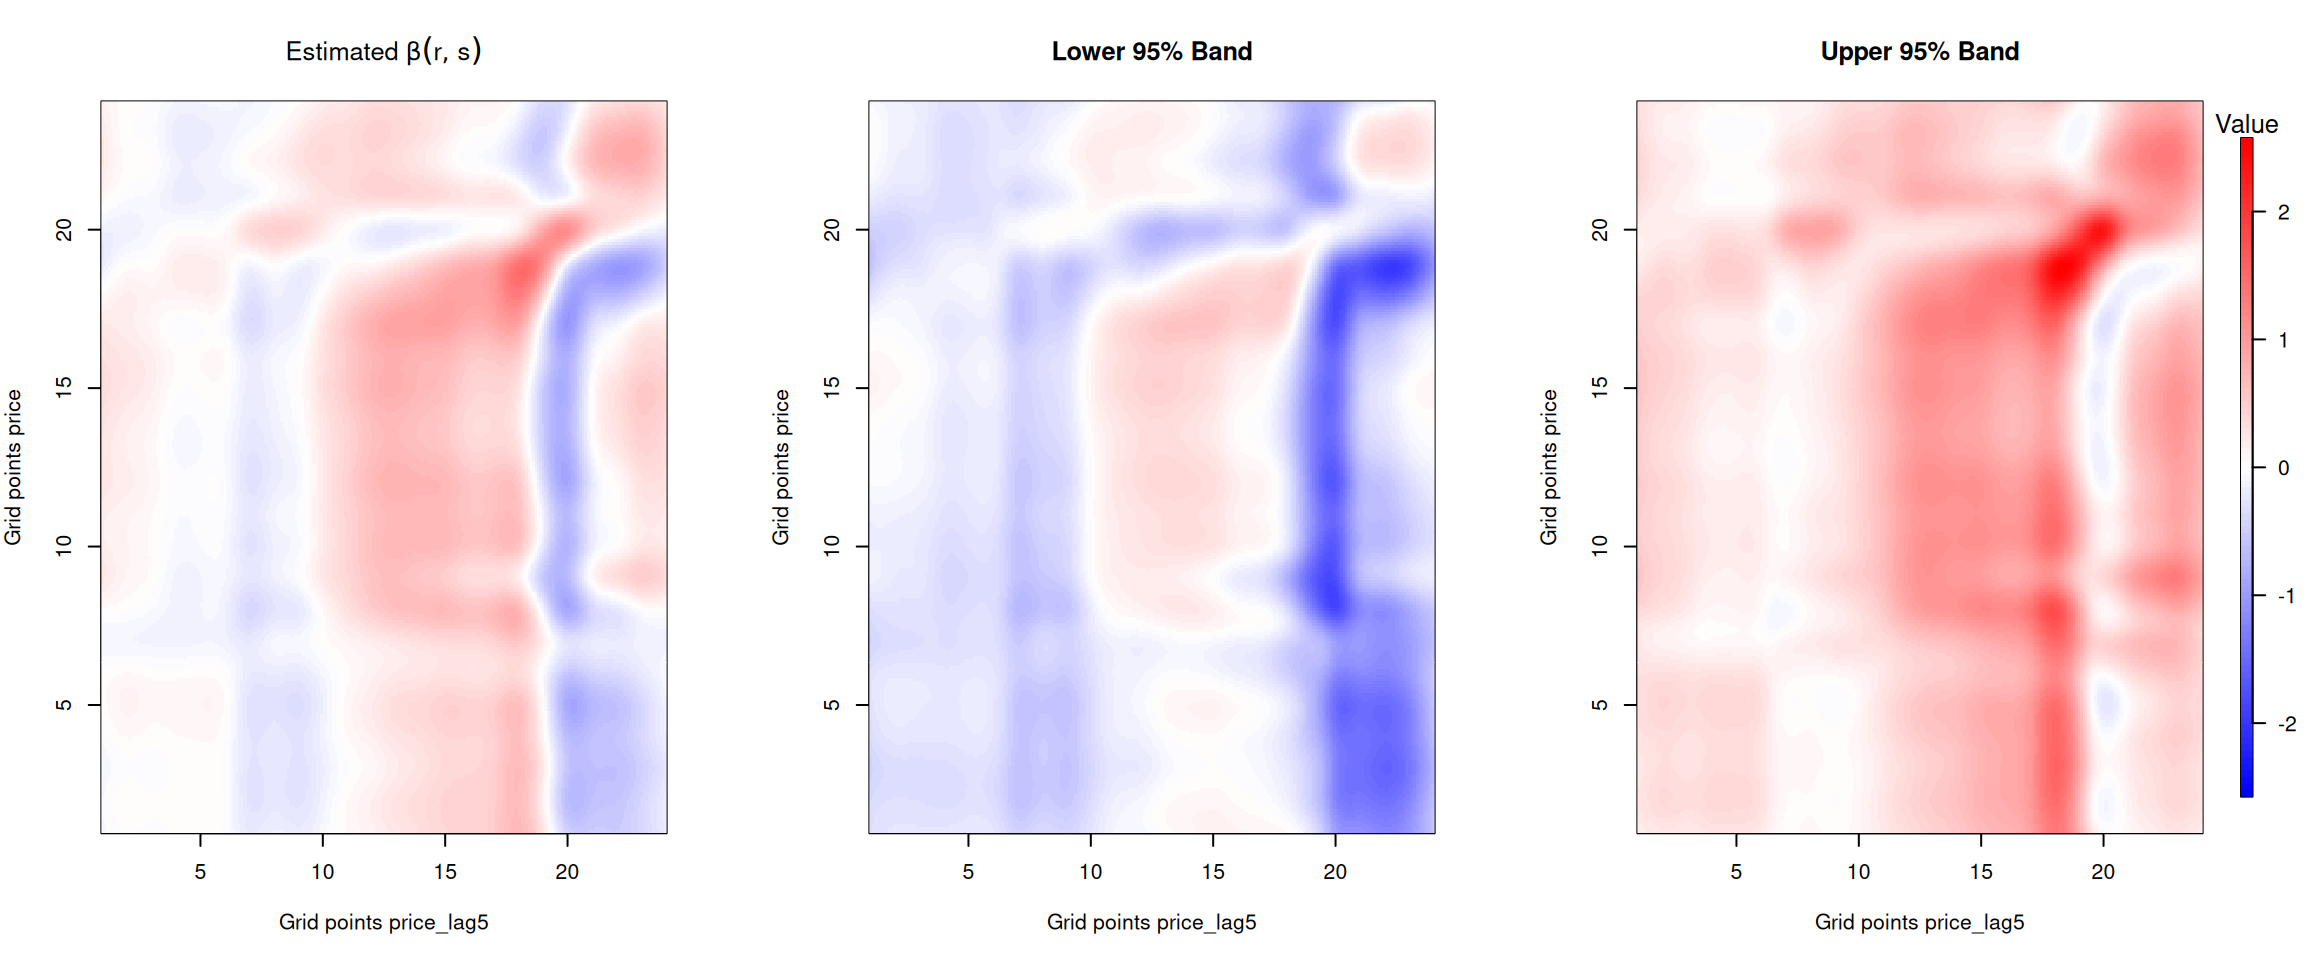
Figure 3: Beta coefficient for the one week lagged price.
Load forecast coefficients
The plots below show how the forecasted electricity loads influence current prices throughout the day. The x-axis represents the time of day for the load forecast, while the y-axis represents the time of day for the current price.
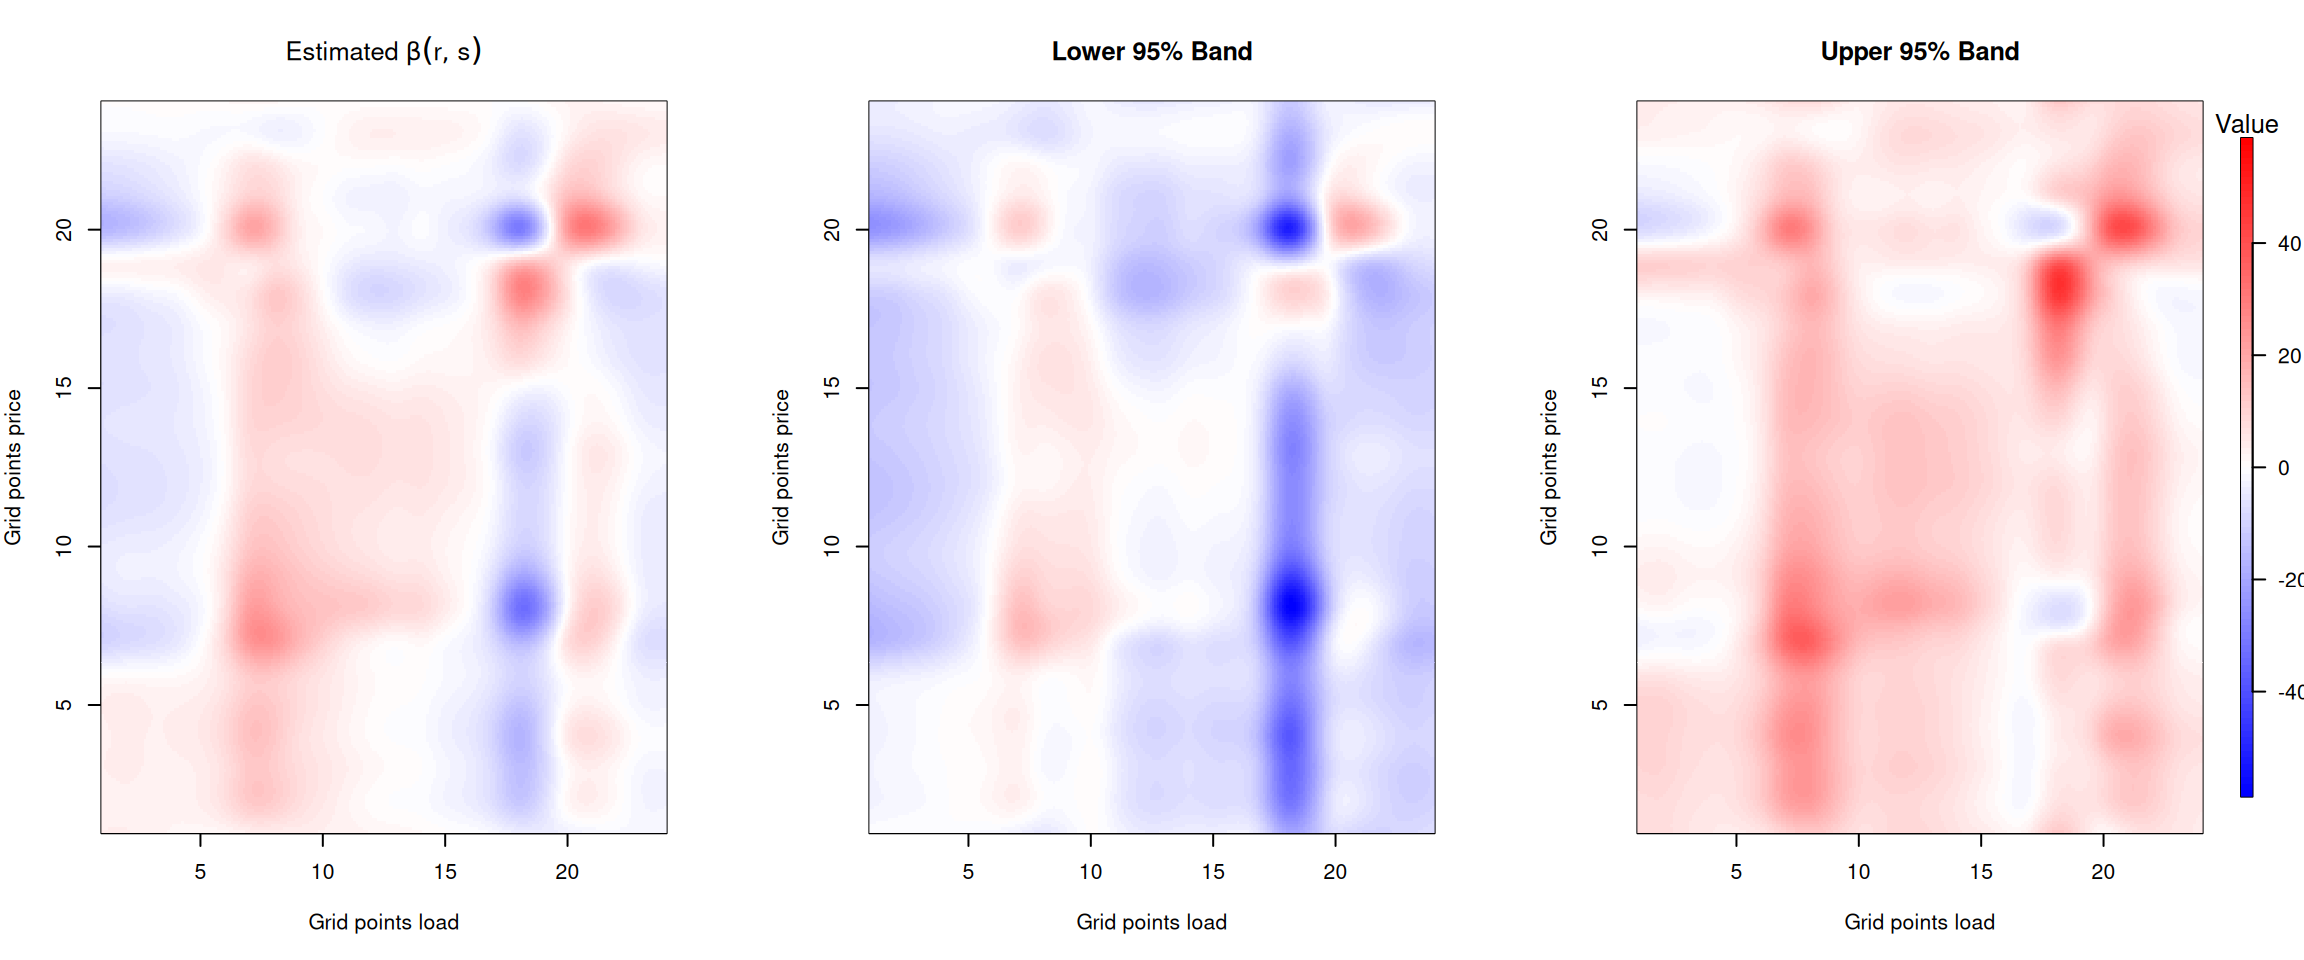
Figure 4: Beta coefficient for the forecasted electricity load.
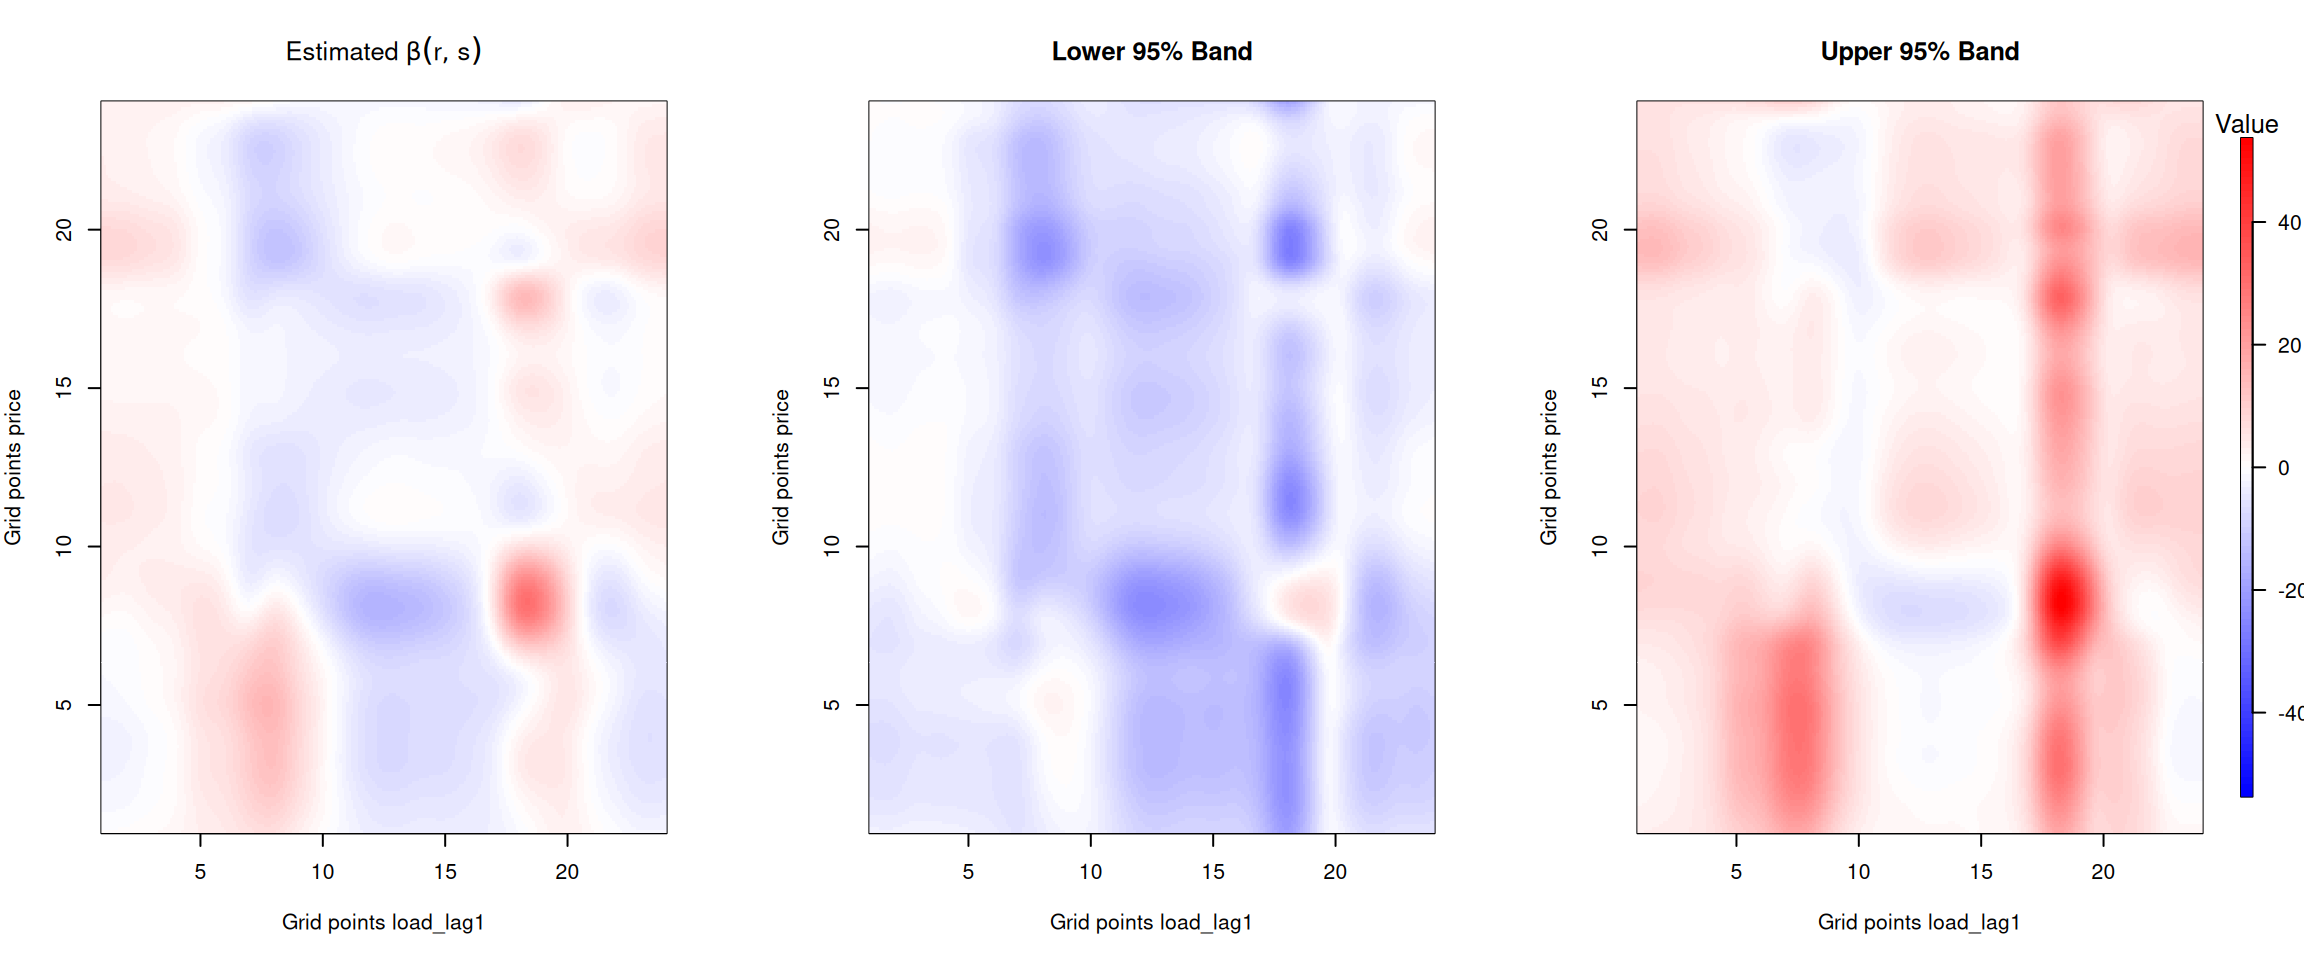
Figure 5: Beta coefficient for the one day lagged forecasted electricity load.
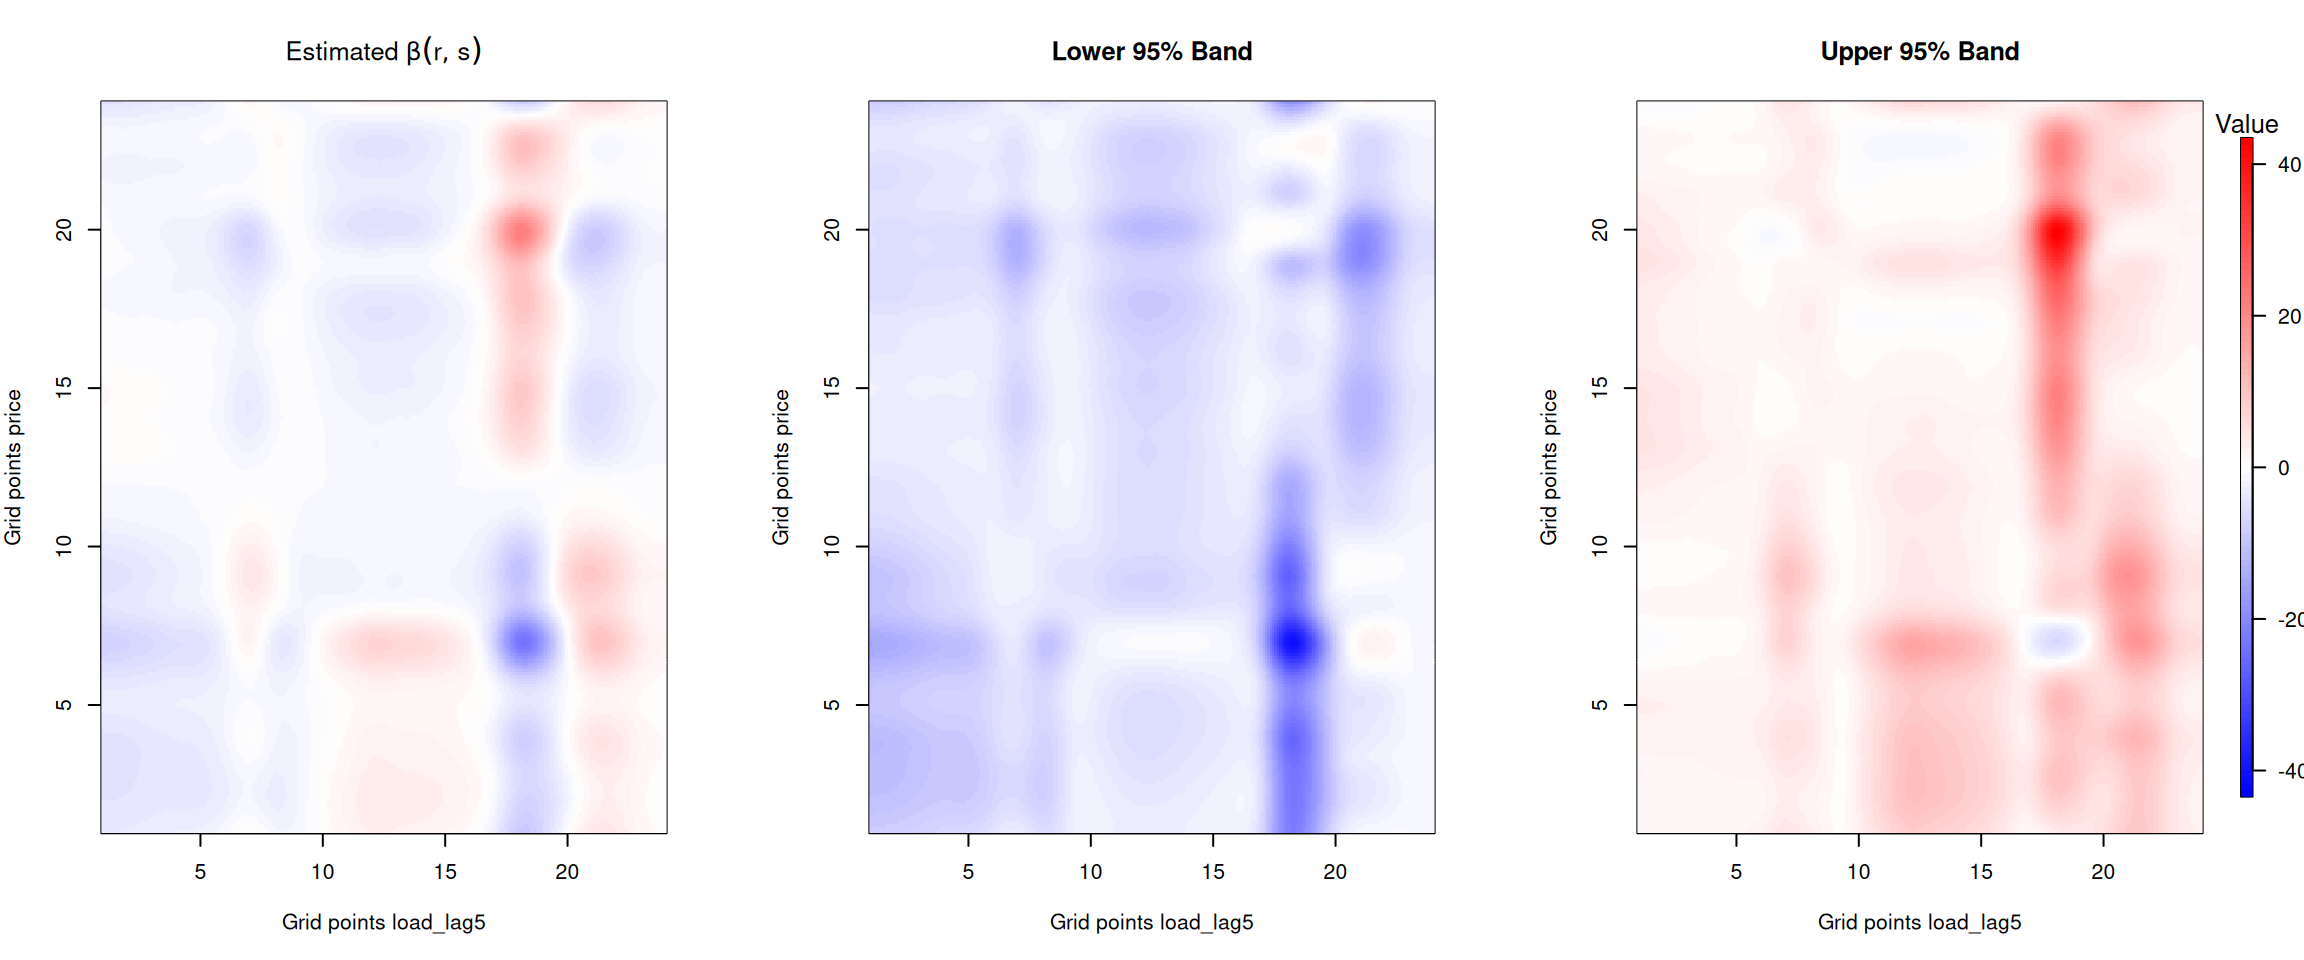
Figure 6: Beta coefficient for the one week lagged forecasted electricity load.
Wind and solar forecast coefficients
The plots below show how the forecasted wind and solar generation influence current prices throughout the day. The x-axis represents the time of day for the generation forecast, while the y-axis represents the time of day for the current price.
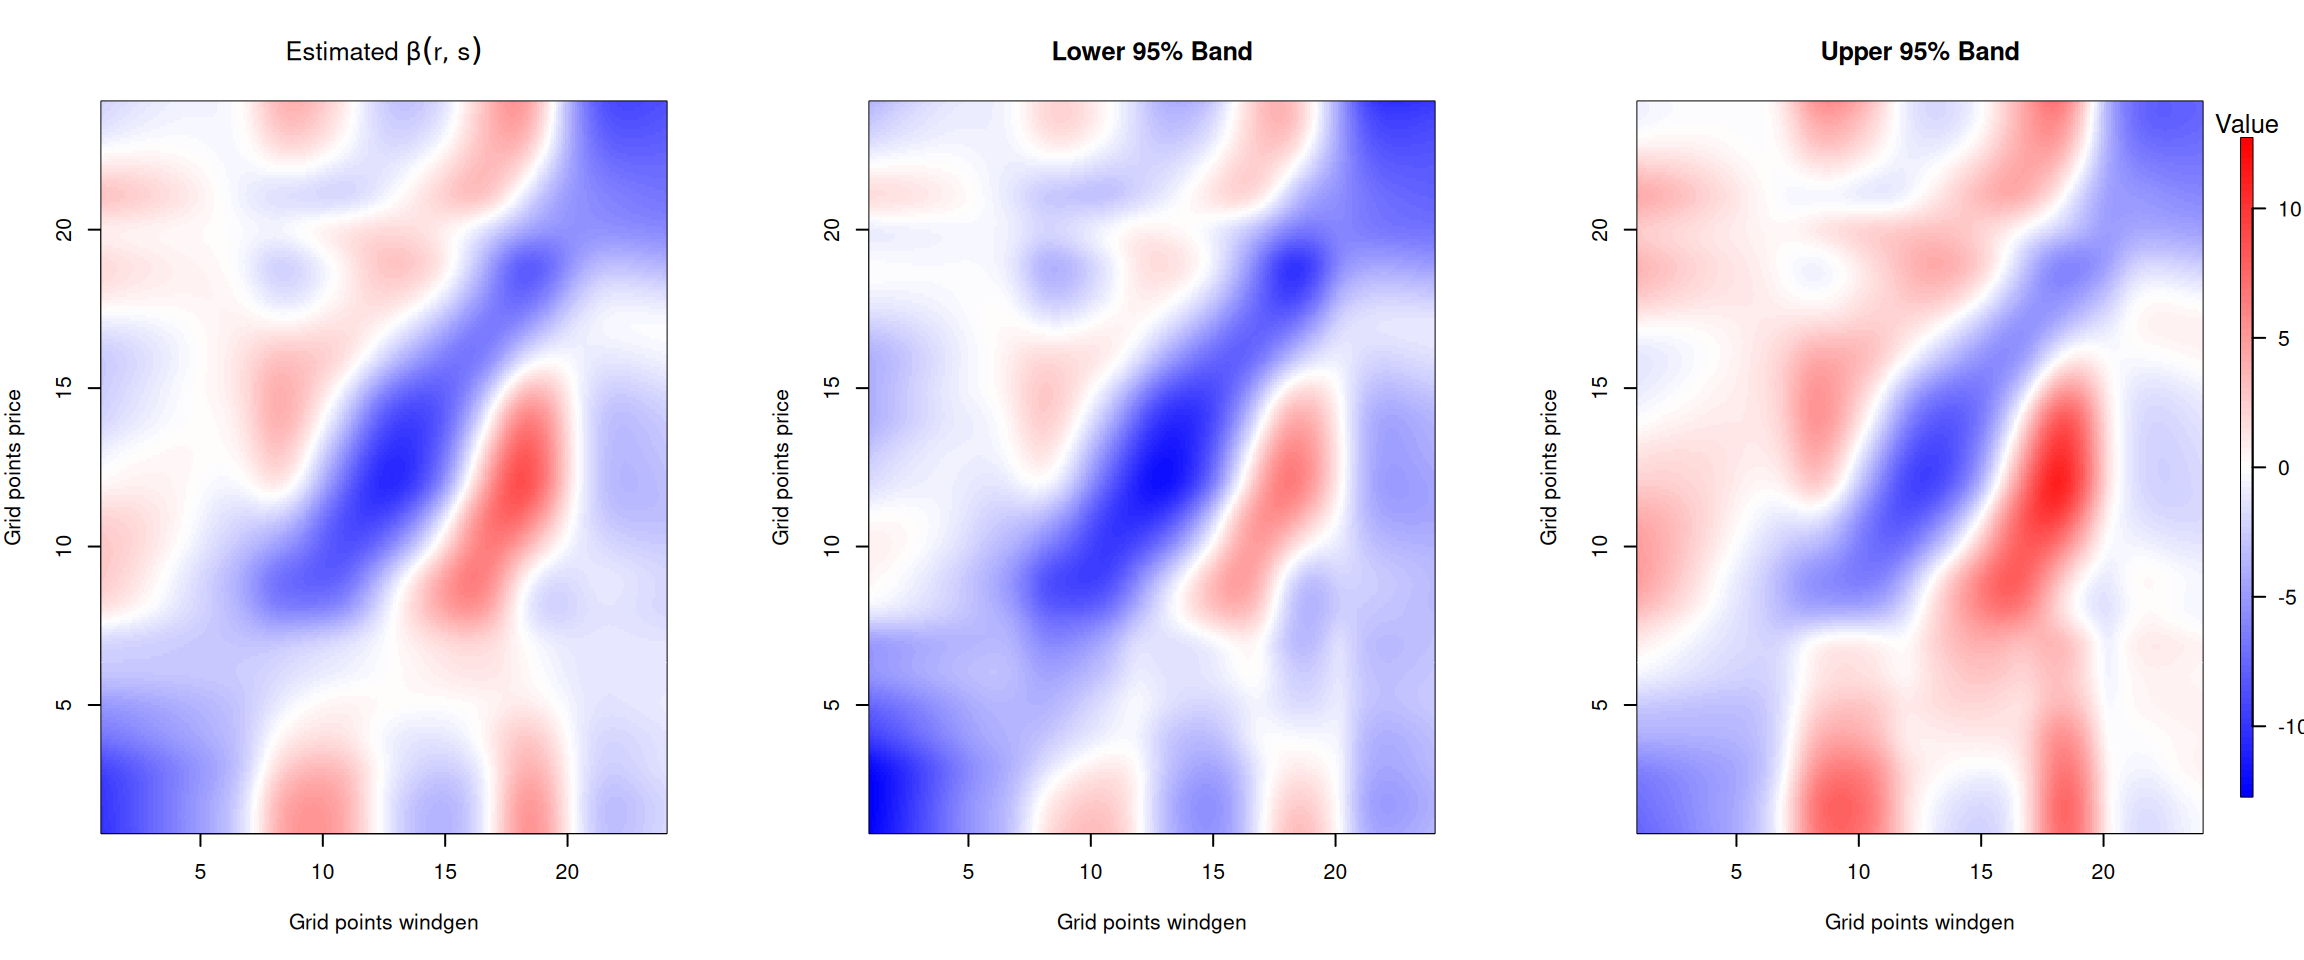
Figure 7: Beta coefficient for the forecasted wind and solar generation.
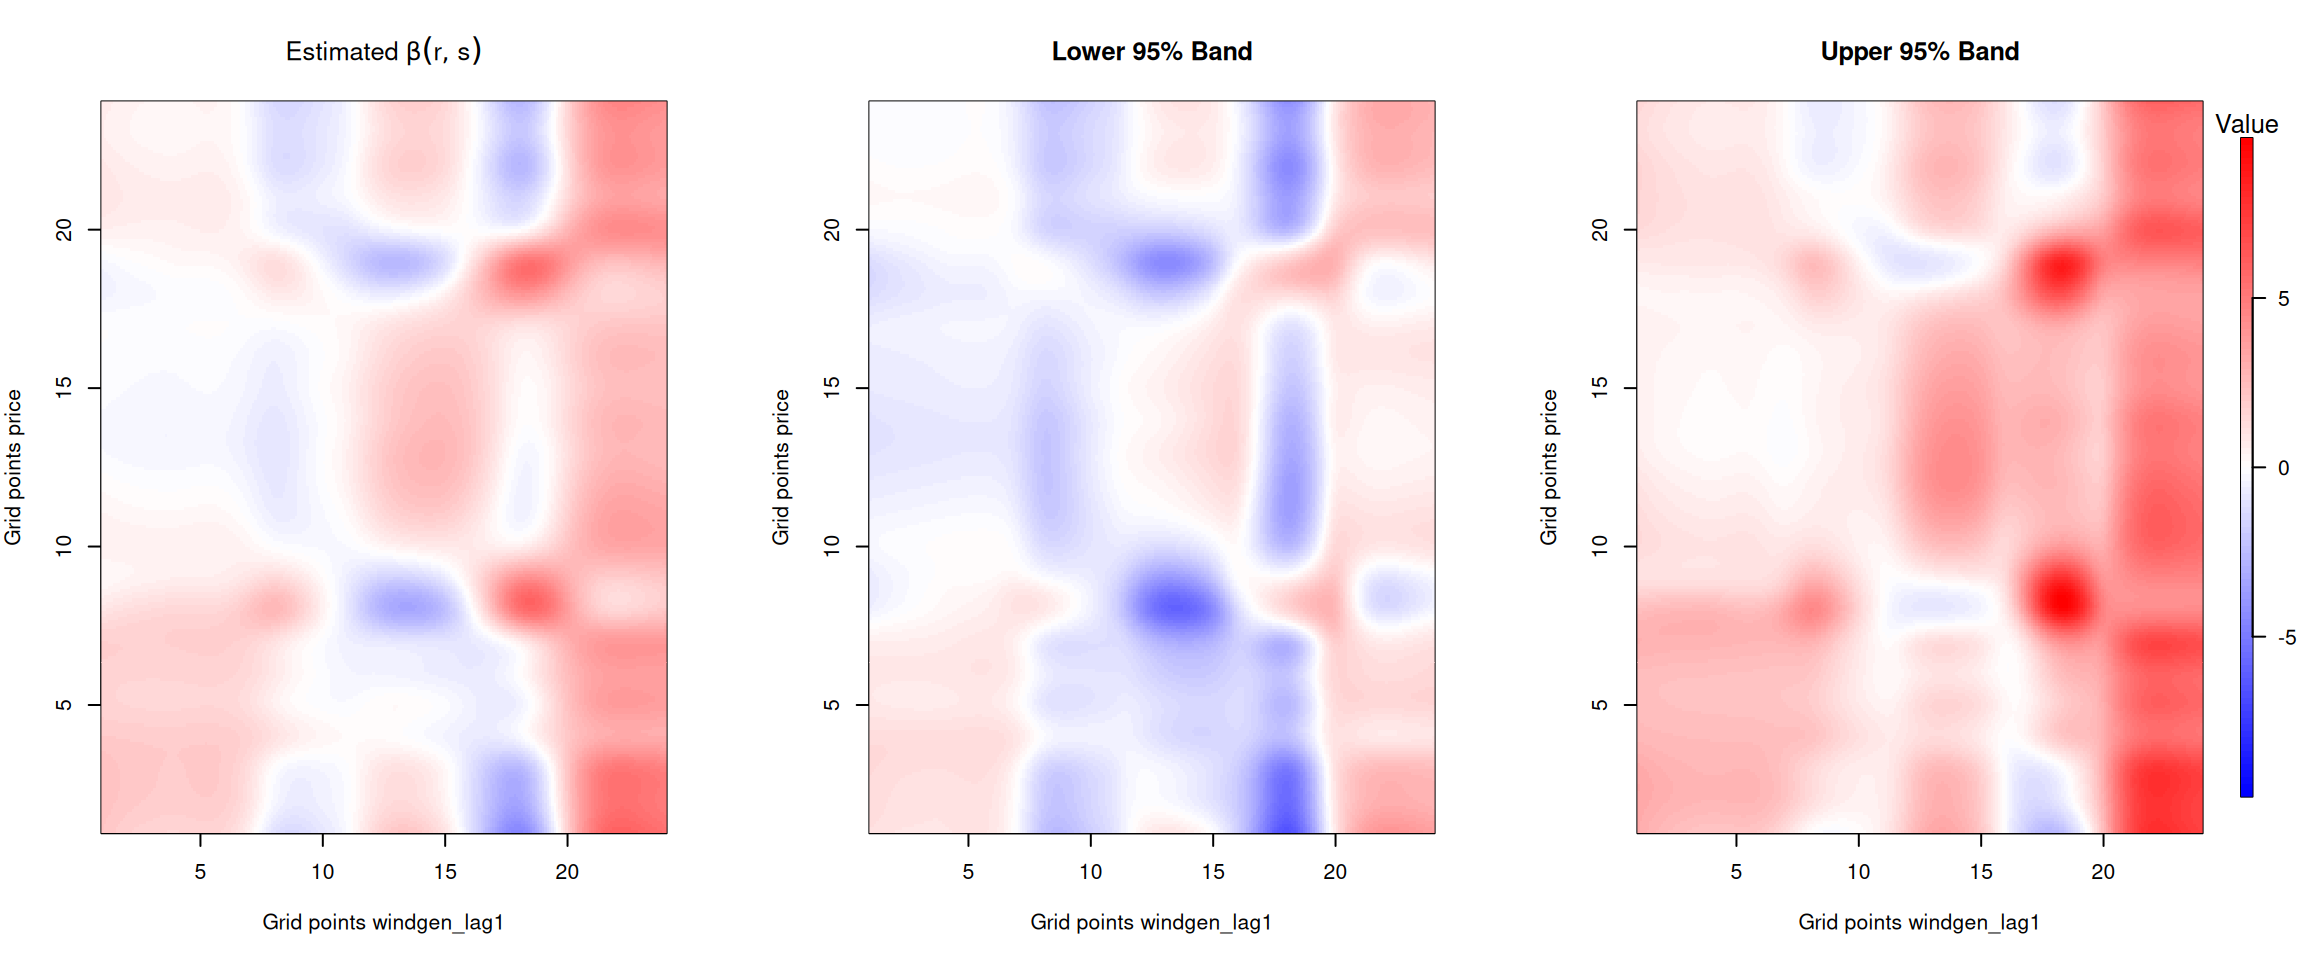
Figure 8: Beta coefficient for the one day lagged forecasted wind and solar generation.
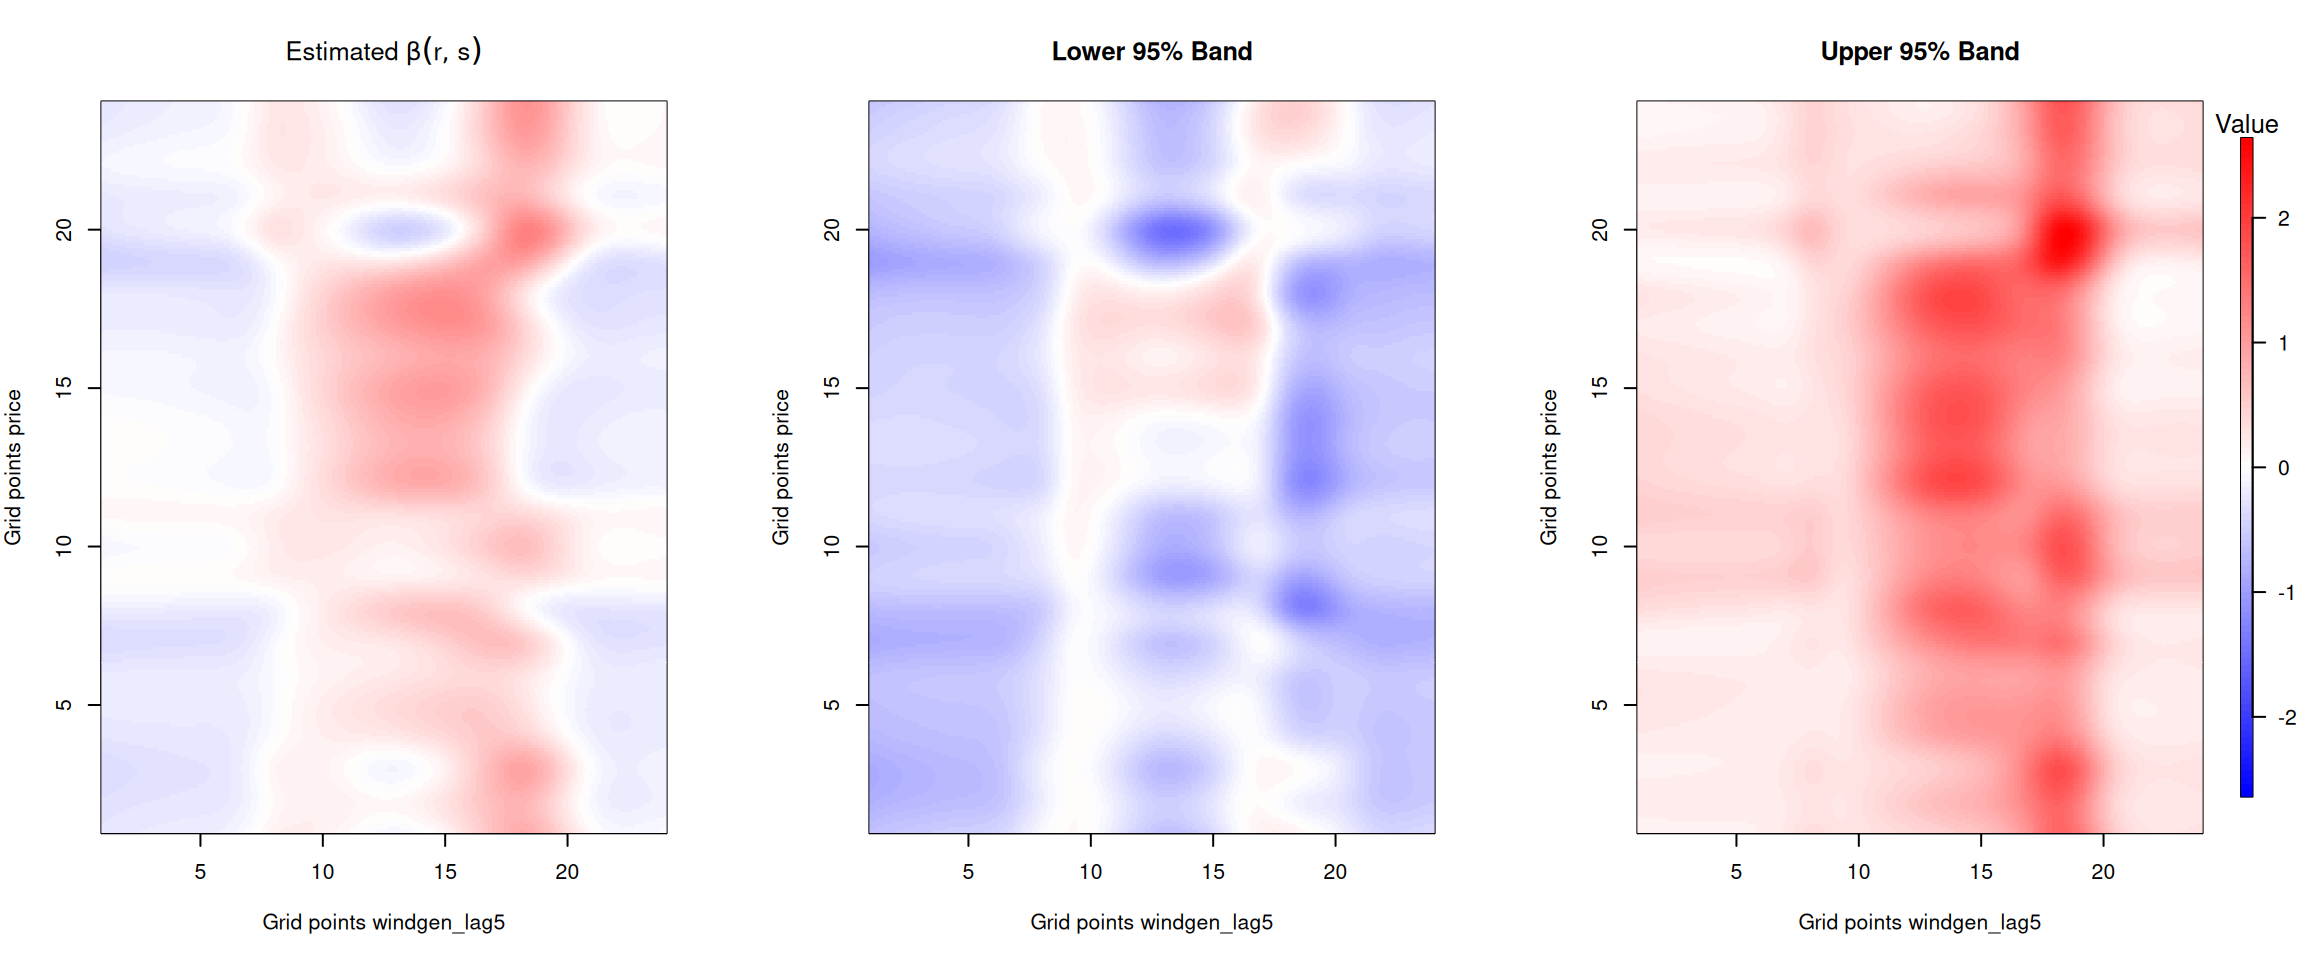
Figure 9: Beta coefficient for the one week lagged forecasted wind and solar generation.
Intercept
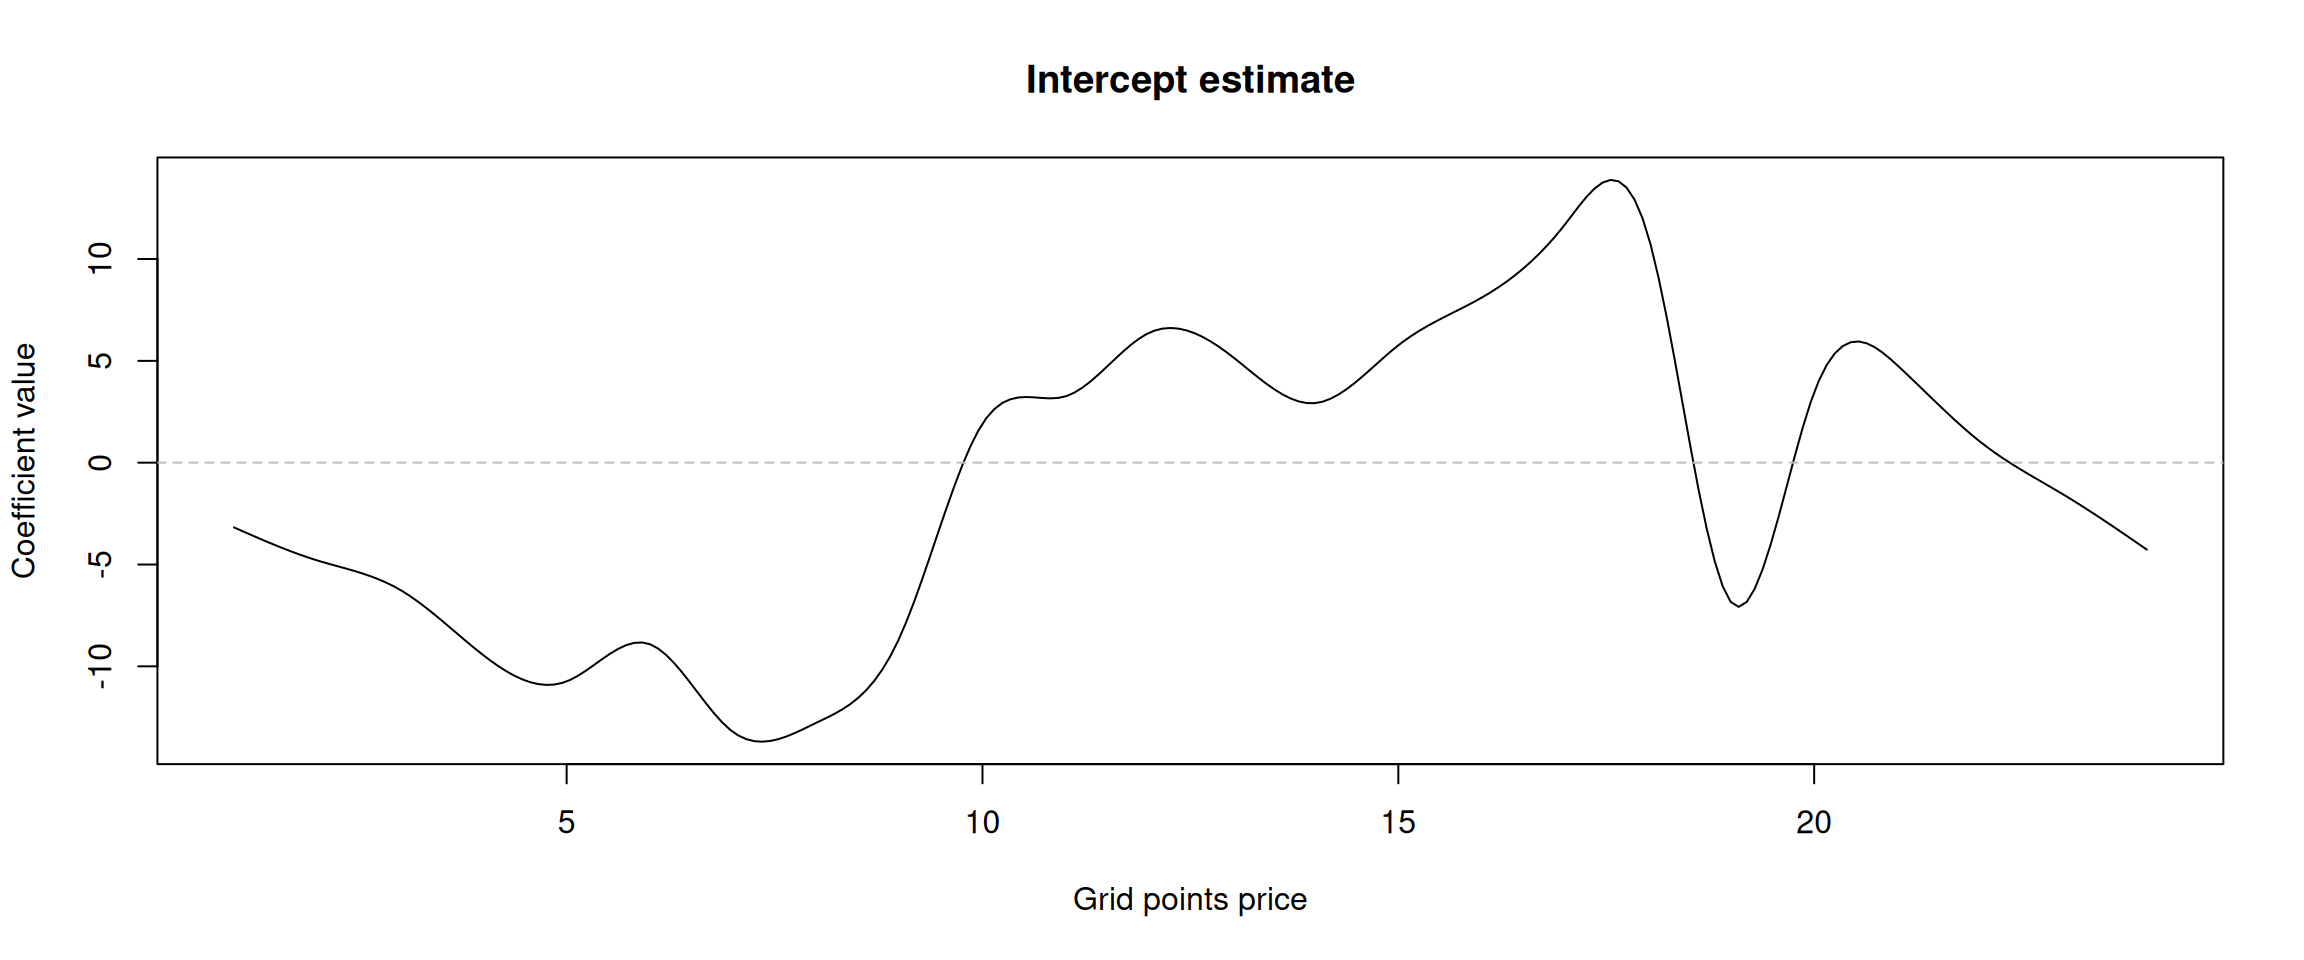
Figure 10: Intercept coefficient.
Scalar regressors
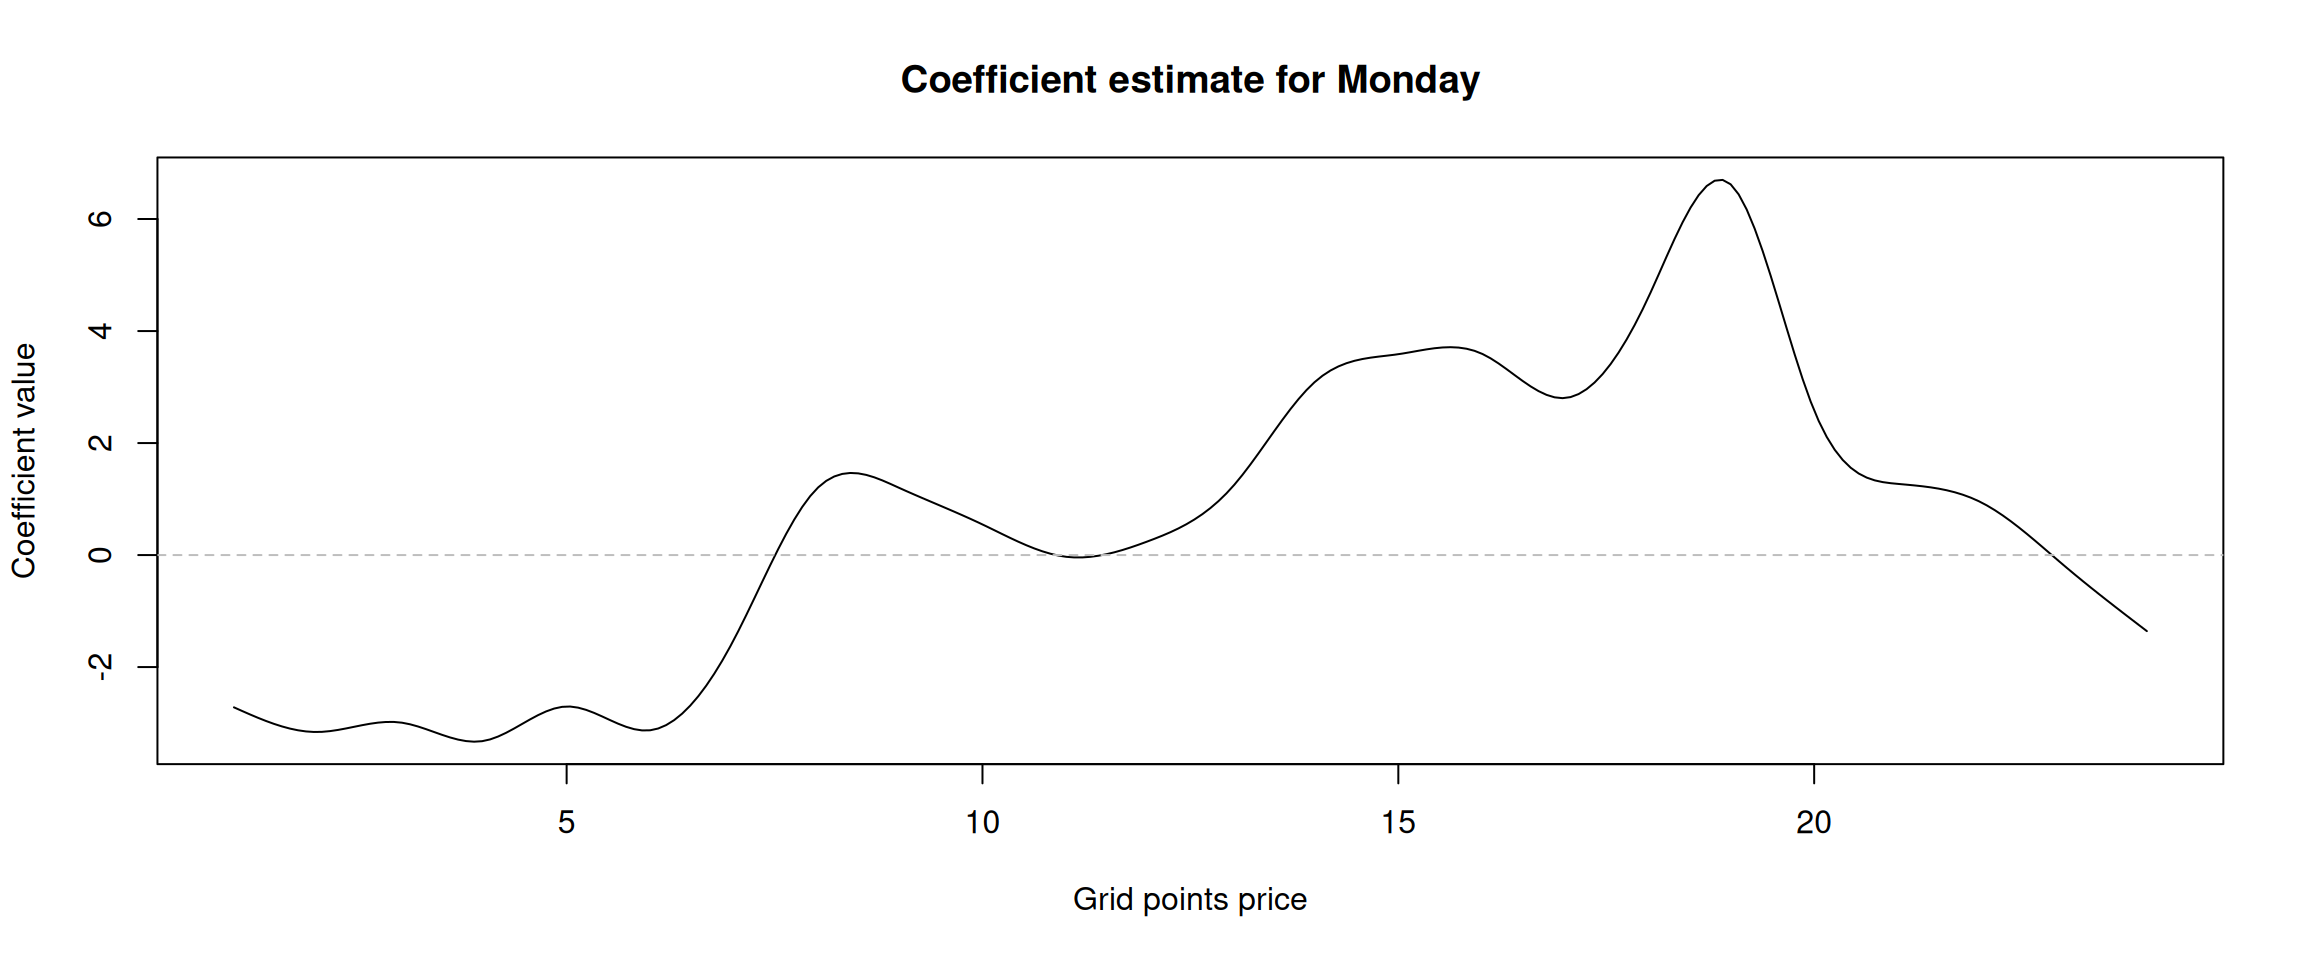
Figure 11: Alpha coefficient of the “Monday” dummy variable.
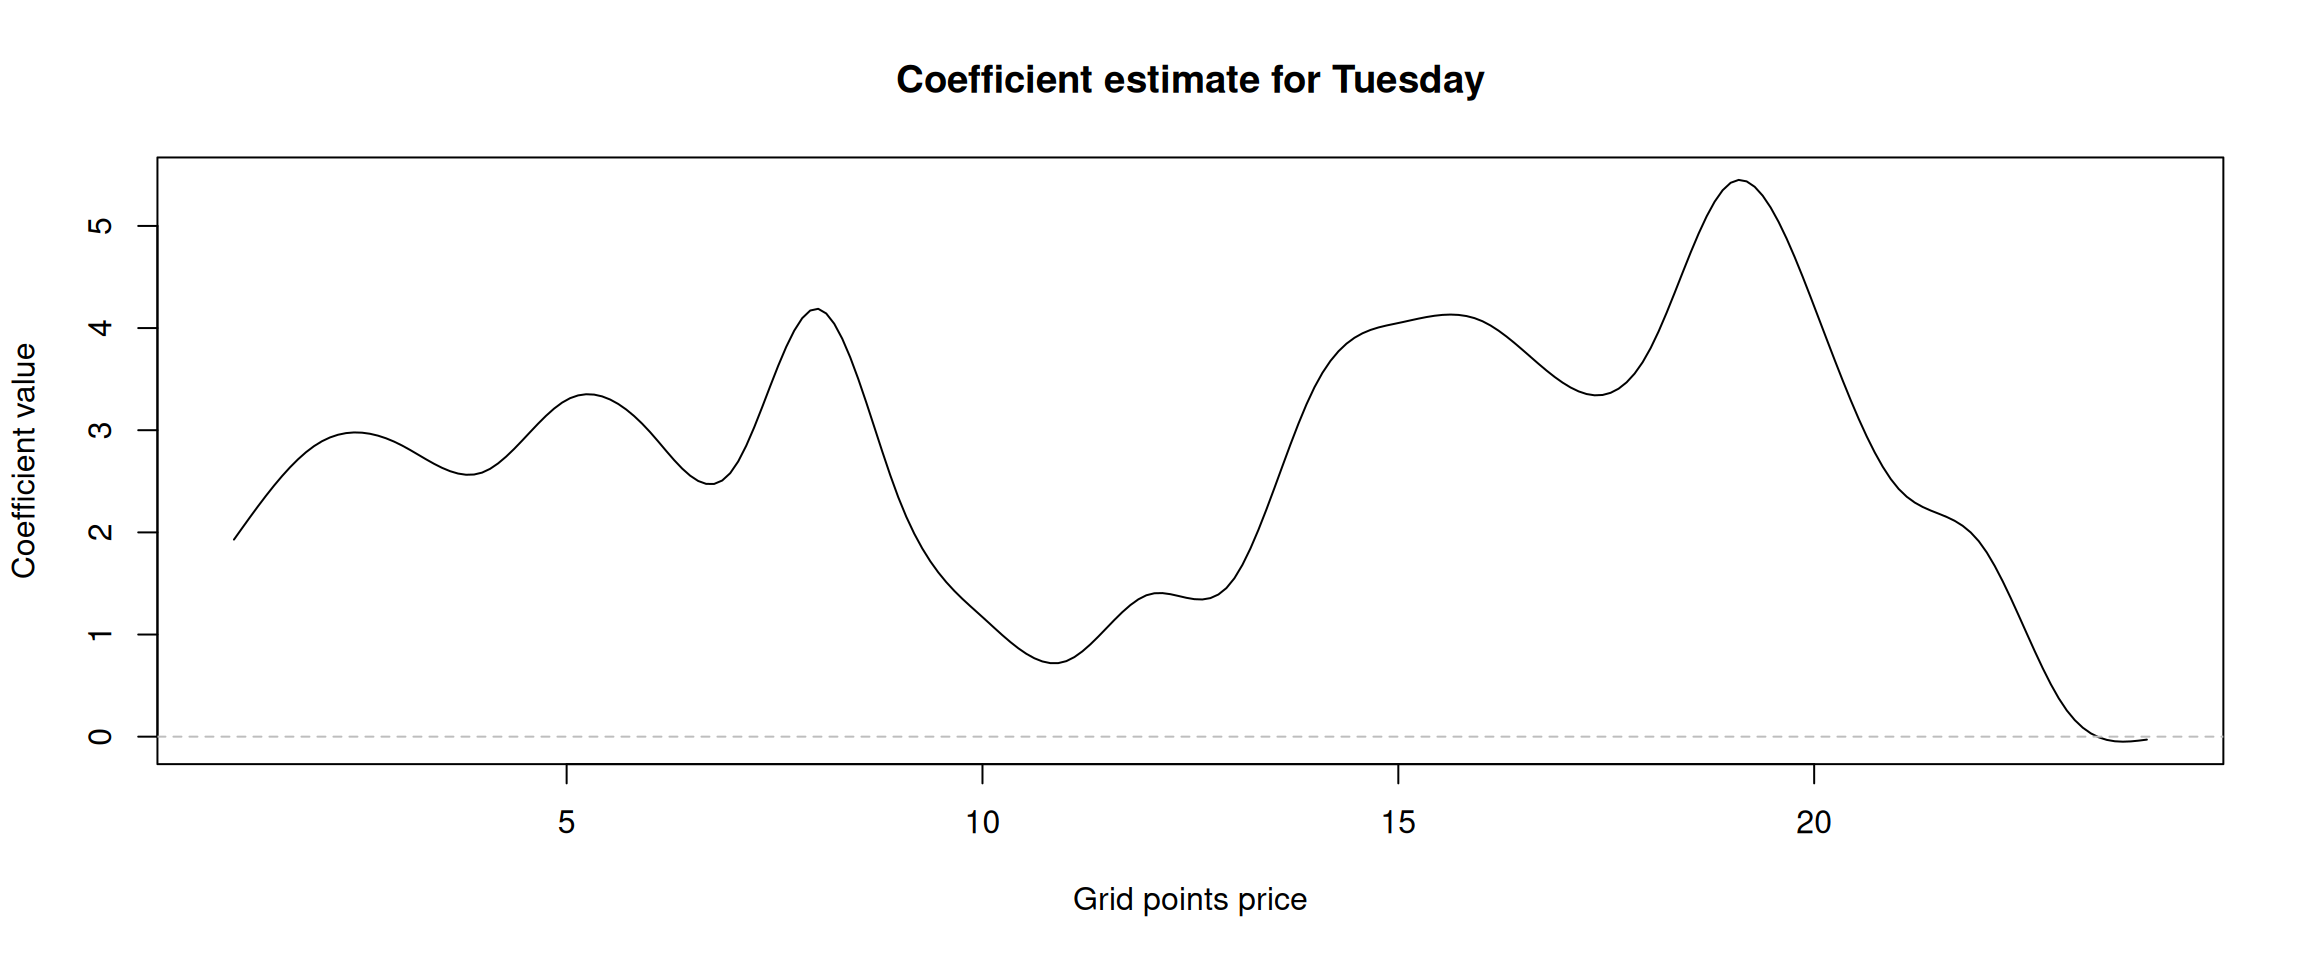
Figure 12: Alpha coefficient of the “Tuesday” dummy variable.
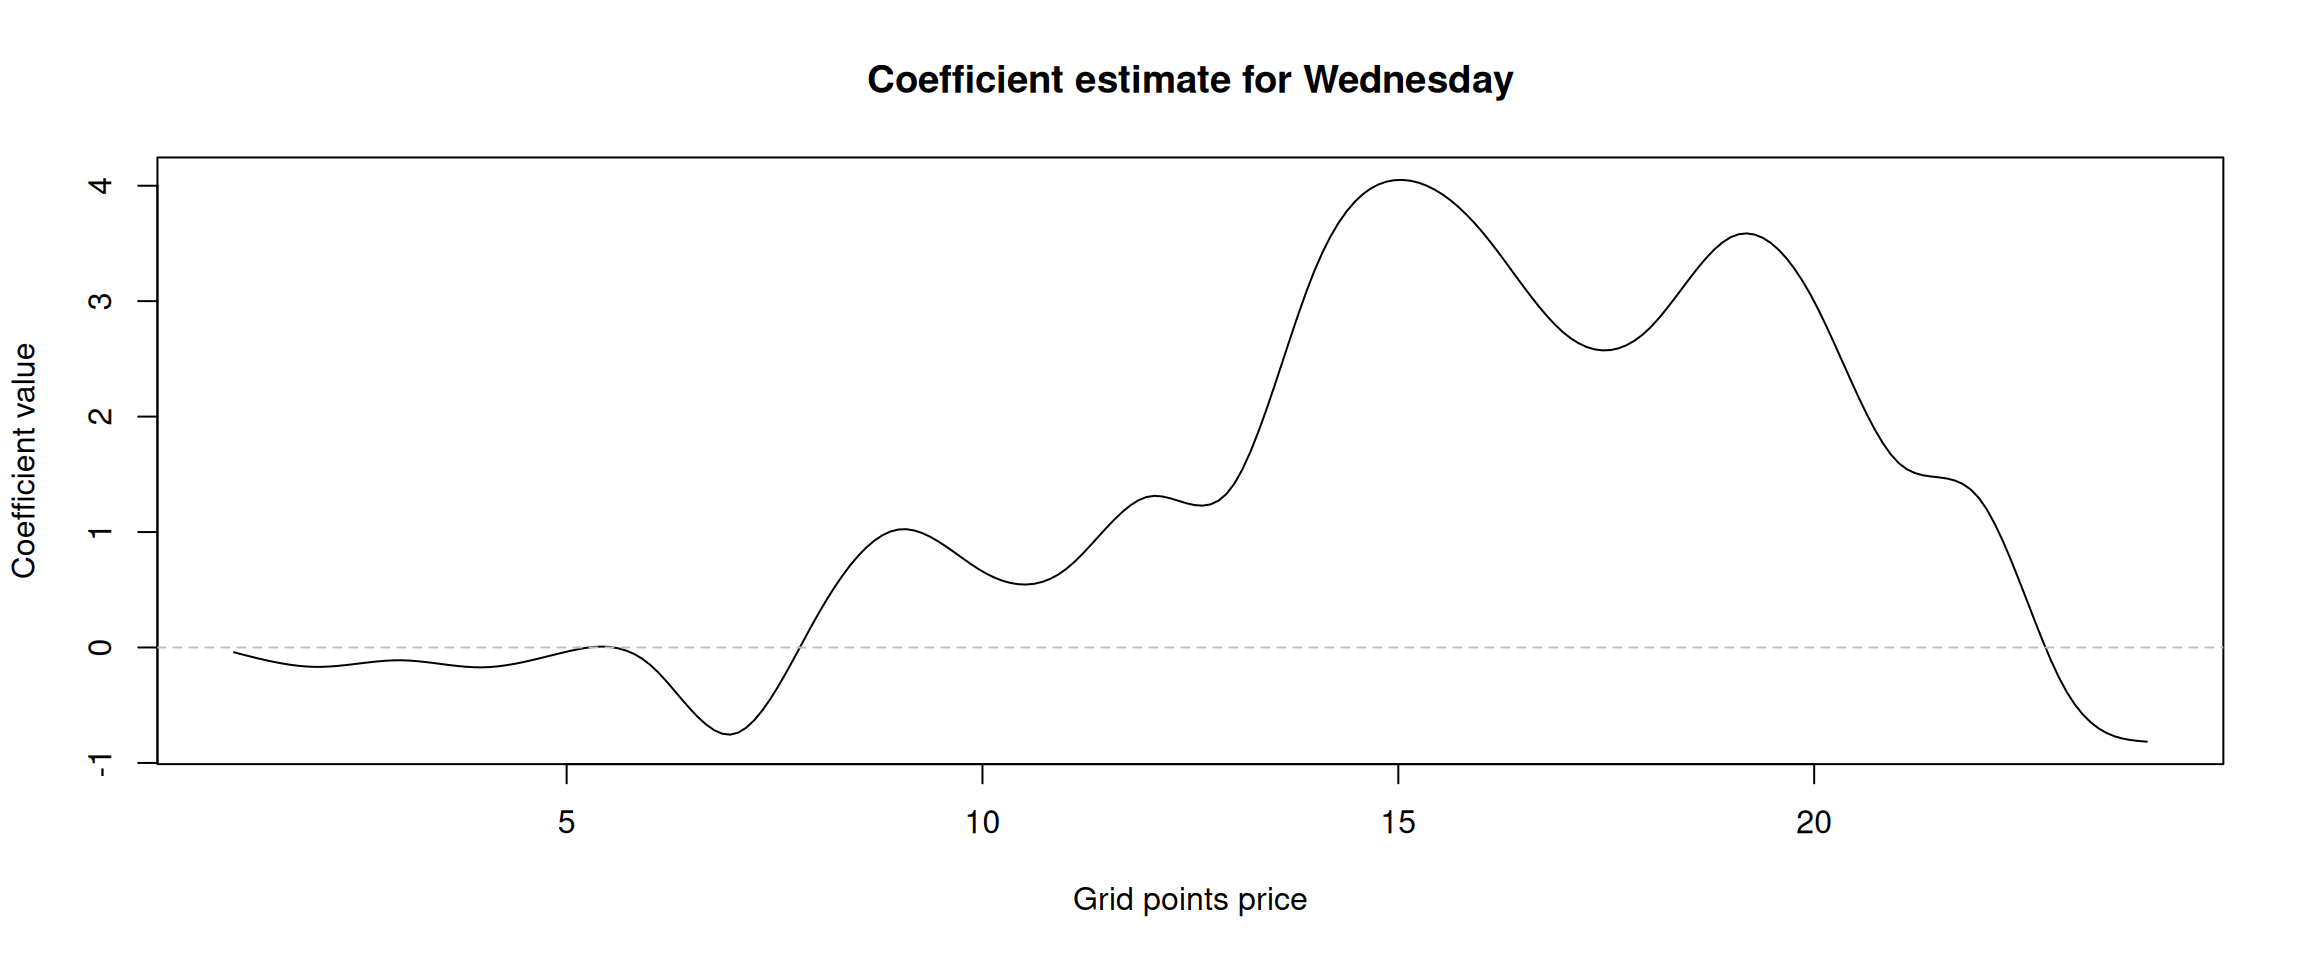
Figure 13: Alpha coefficient of the “Wednesday” dummy variable.
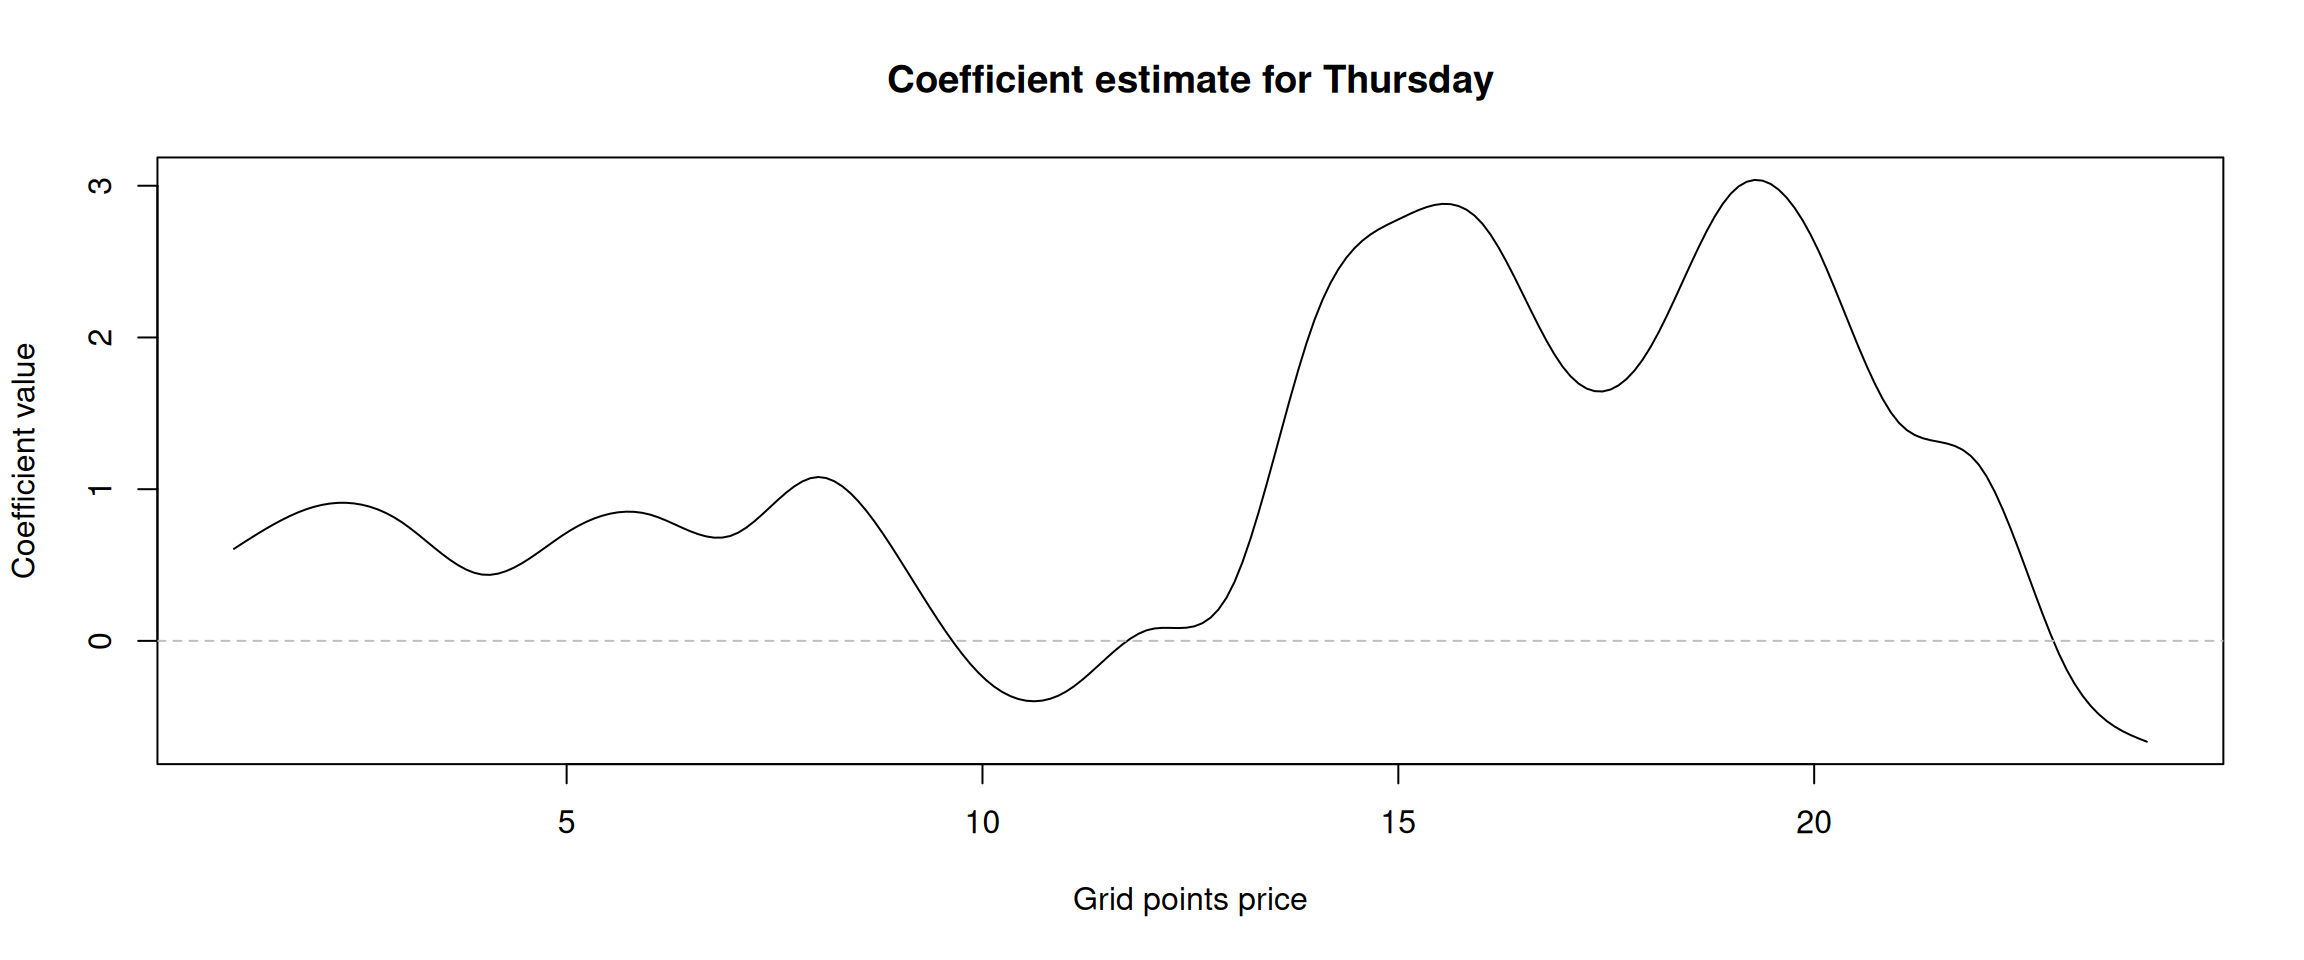
Figure 14: Alpha coefficient of the “Thursday” dummy variable.